01 / Personal
Learning through printing
A printed motor, helmet, and MagSafe stand turned iteration into a daily engineering habit. The motor spins, but its PLA structural parts overheat under load.

Mechanical Systems Engineer, Controls. The Raymond Corporation.
Binghamton and Rochester, New York
I'm a mechanical systems engineer from Semey, Kazakhstan. I moved to the United States in 2016 and earned a BS and an MEng in mechanical engineering from RIT, with a controls concentration. At Raymond, I work on vehicle controls, including hydraulic weight sensing and steering systems.
Product engineering on variable camshaft timing. The teardown reports went to Cummins, Harley-Davidson, and Ford.
Packaging reliability on the non-alcoholic drinks line, from finding where the line lost time to prototyping the fix. It lifted Overall Equipment Effectiveness 7 percent.
Chapter 05
Choose a study: personal printing, ceramic molds, slicing software or polymer simulation.
01 / Personal
A printed motor, helmet, and MagSafe stand turned iteration into a daily engineering habit. The motor spins, but its PLA structural parts overheat under load.
Choose a project to read its story.
A personal steel-frame CNC build. I used Fusion 360 and printed alignment parts, then wired a 2.2 kW spindle with shielded cabling and a star ground.
Three RIT studies: a double pendulum, a vacuum cannon, and quaternion flight dynamics. They pair calculations with physical tests or flight-test reference data.
ANSYS training, AMPrint research, and Raymond tractor-frame structural work. Each has a different record, from a hand calculation to CFD or strain-gauge testing.
Selected work
I build websites as a side hobby.

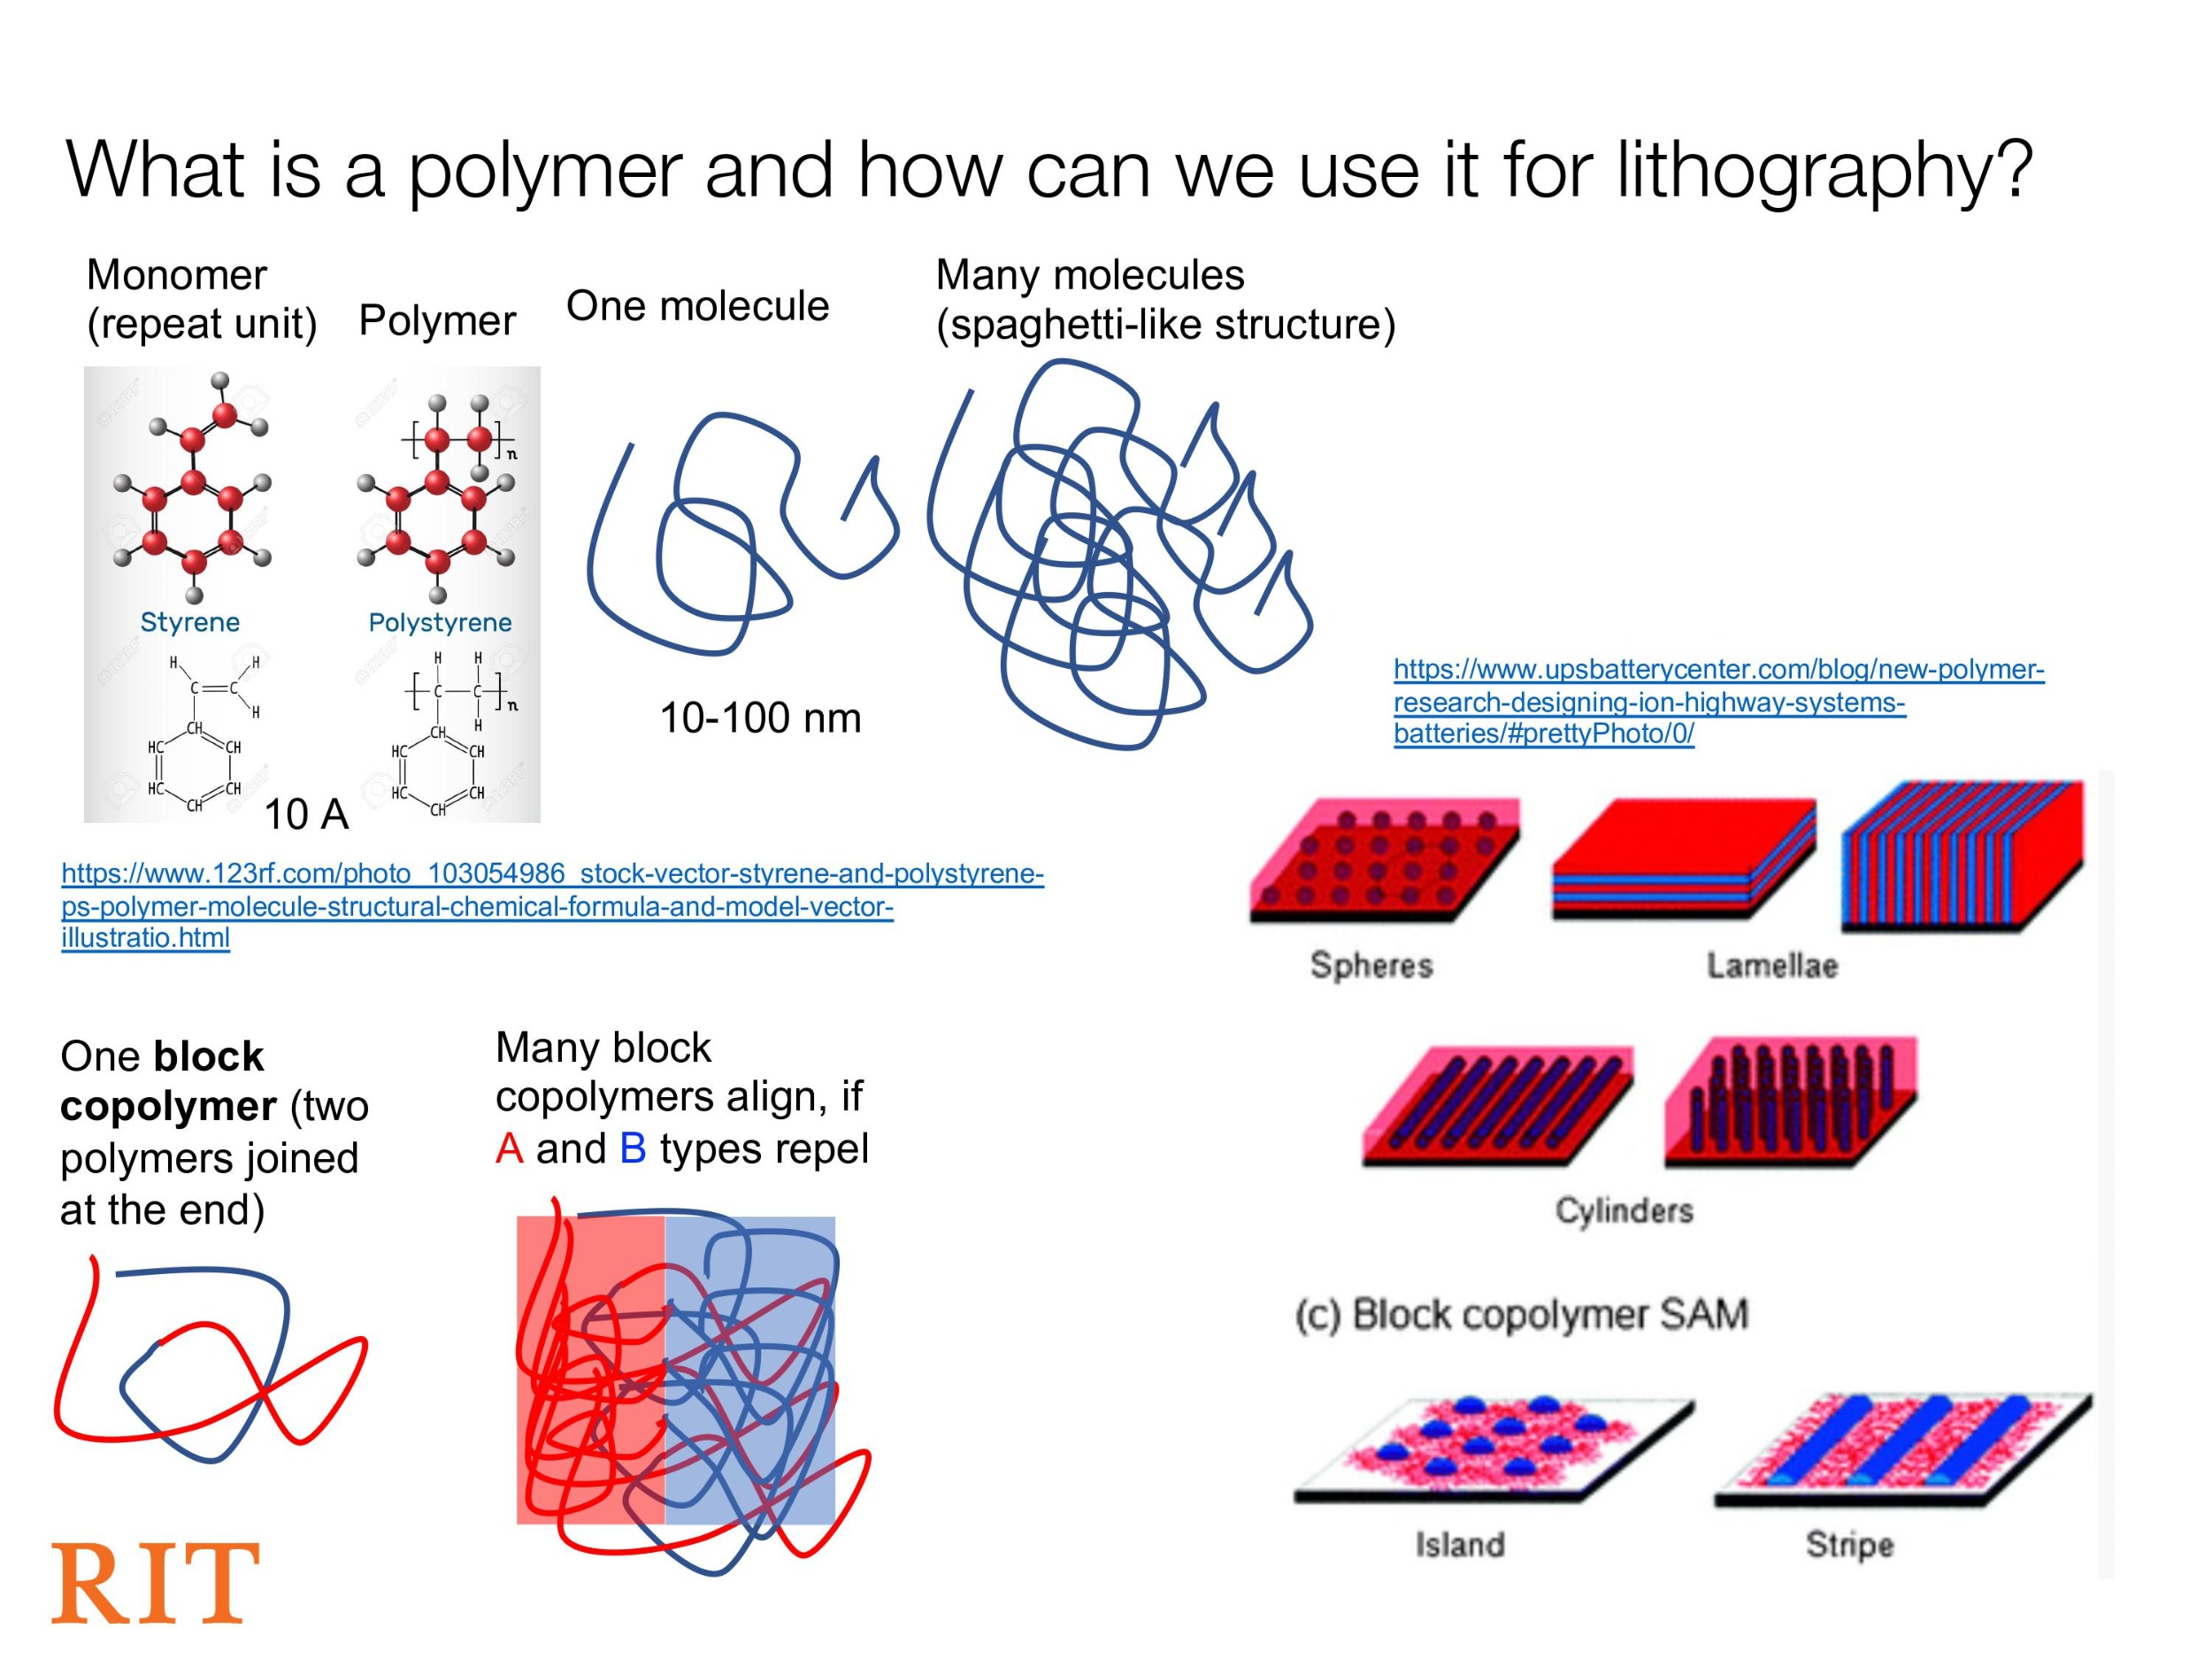
A polymer is a macromolecule in which many groups of atoms, or monomers, are bonded together to form a linear chain-like molecule. The molecules adopt a structure that is similar to a bowl of spaghetti; interconnected and disordered chains looping through each other. Due to advances in chemistry, we can control atomic bondings within each molecule precisely.
We can then tailor these materials to perform lithography. The principle is simple: much like water and oil form distinct regions in a container, water-like and oil-like macromolecules can be joined together to form a block copolymer. Here, the water-like portion is shown in blue and the oil-like portion is shown in red.
When many block copolymer molecules are placed together, they will first adopt a spaghetti like structure, but because the red and blue types repel, they will instead transform such that the molecules align and create a pattern. If we zoom out, we can see layers of red and blue molecules forming a stripe pattern in this example. Depending on the ratio of red to blue types and the actual chemistry of the molecules, a wide variety of extremely thin shapes can be formed. Some examples are circular holes, spheres, stripes, and many other structures. These shapes are then used in lithography.
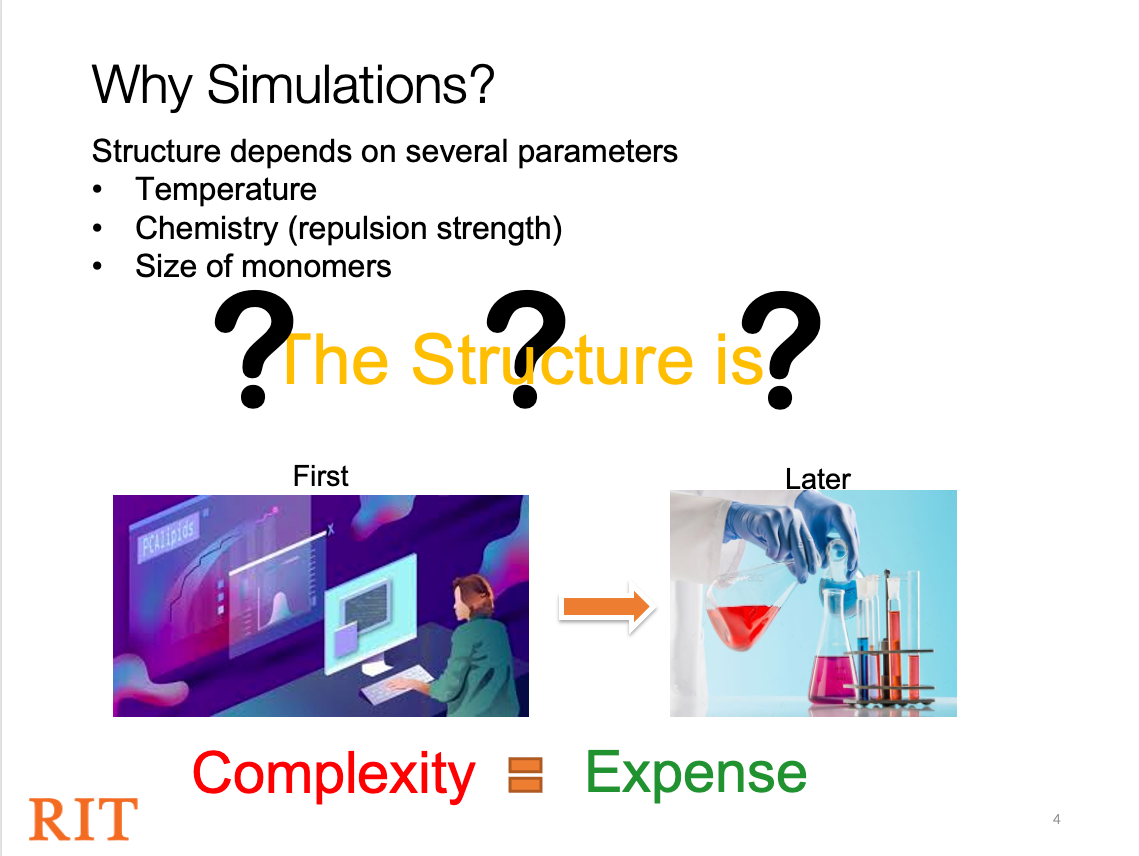
Instead of conducting experiments, we created and analyzed simulations of the polymers. Our decision was not based on that the COVID-19 would not allow us to use laboratories for the experiments. There are three other main reasons for choosing simulations.
Basically, the shape of polymers and their behavior depends on many conditions, such as temperature, chemistry (or repulsion strength), sizes of the atoms, and many more parameters. And each parameter will affect the exact molecular structure in a chaotic and random way, so it is impossible to know what structure a given molecule will have. Therefore, we do not have a starting point for the experiments, and it would be too wasteful to conduct a bunch of experiments without a clear goal we can get based on what we already know.
To avoid this problem, we can conduct thousands of simulations that are going to give us a general sense about the polymer structure under different conditions. Since simulations take less time to conduct and analyze, we would be able to get a general understanding about the polymer structures way faster. Based on the results of our simulations, we can understand where to start the experiments, and what experiments we need to conduct to efficiently perform polymer-based lithography.
Most importantly, conducting the experiments is much more expensive than simulations. Since we did not have a starting point for the data analysis, it took us at least 50 simulations to narrow the scope down to specific conditions under which we can observe the behavior of phase separation of atoms. And, unfortunately, even 50 experiments are way too expensive and inefficient for our research.
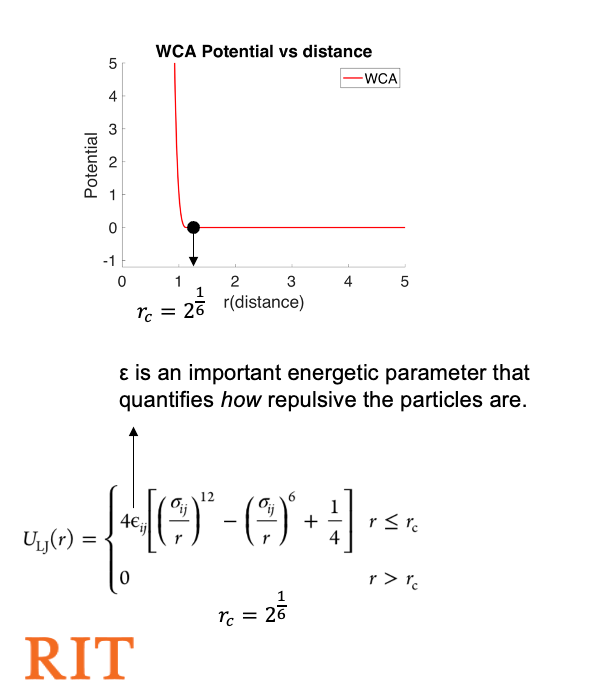
Now, let’s talk about the basis of our modeling. We know that all particles obey Newton’s laws of motion. If we consider the simple case of hard spheres or billiard balls, they collide elastically, conserving momentum and kinetic energy. If we provide suitable initial conditions (for example, if their initial velocities face each other), then they will collide, bounce off and will continue their movement in a different direction. We can simply extend this principle to hundreds or even millions of particles! To simulate atoms, we will modify this principle and add small forces based on the chemistry, using the so-called Weeks-Chandler-Anderson (WCA) Potential.
This potential energy is dependent on the size and distance from each other of the particles. Look at the bottom-left graph presented in this slide. This is the general behavior of the WCA Potential, with steep repulsion within a distance between particles under and a flat potential for particles farther than that distance. Therefore, WCA Potential does not have attraction forces. And we can achieve these simulations even with a simple 100 line code.
The exact equation is shown in the bottom left of the slide. The important thing to note is that epsilon is an energetic parameter that quantifies how repulsive the particles are, and will depend on the chemistry of the atoms.
The commonly used programming software MATLAB is inefficient in conducting these simulations, so we use LAMMPS. Since it would take ages for a normal computer to process these simulations, we submitted our simulations to the RIT cluster, which completes a dozen of simulations in a matter of hours.
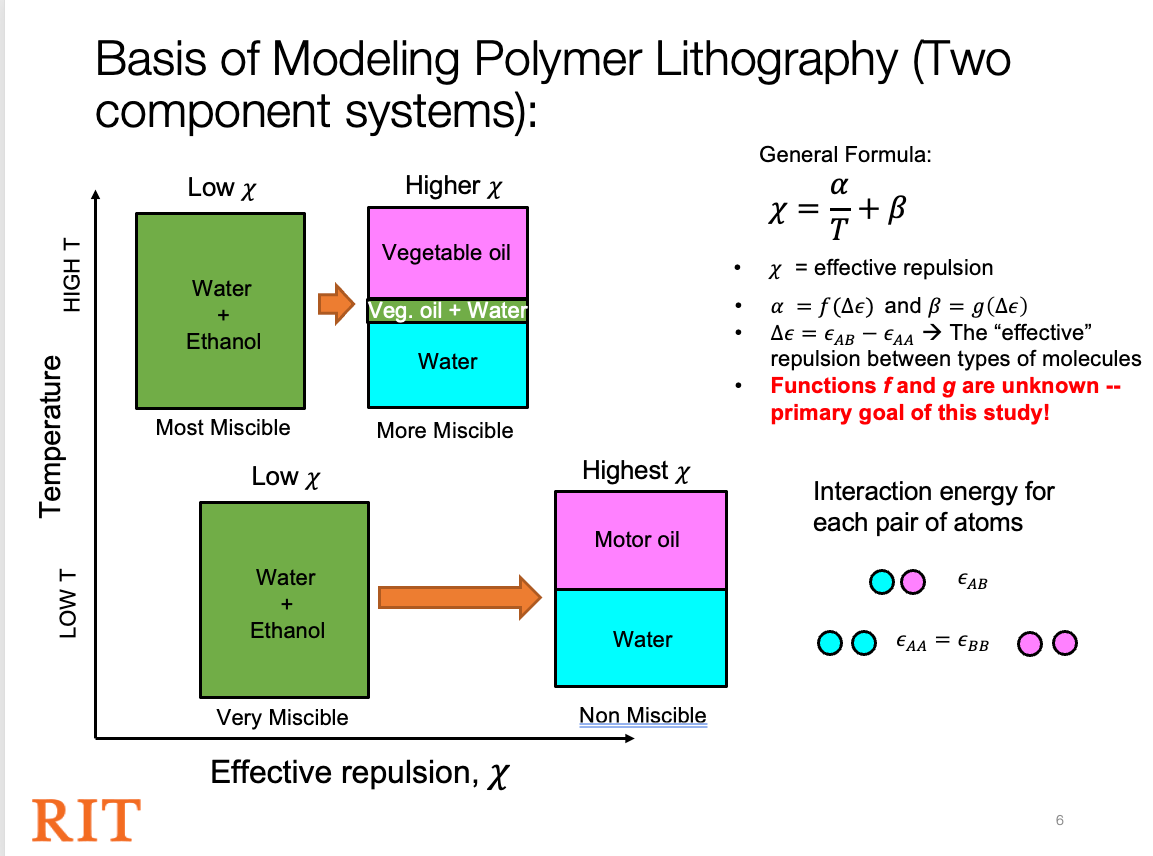
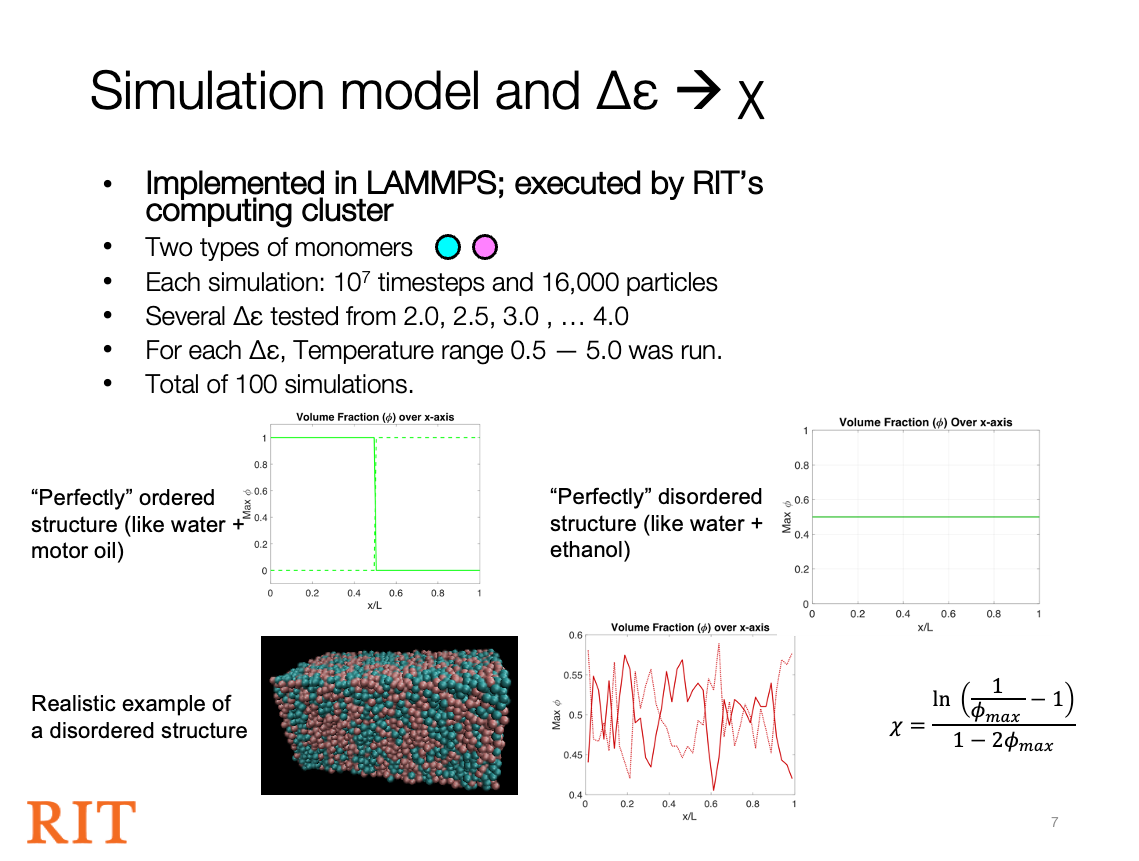
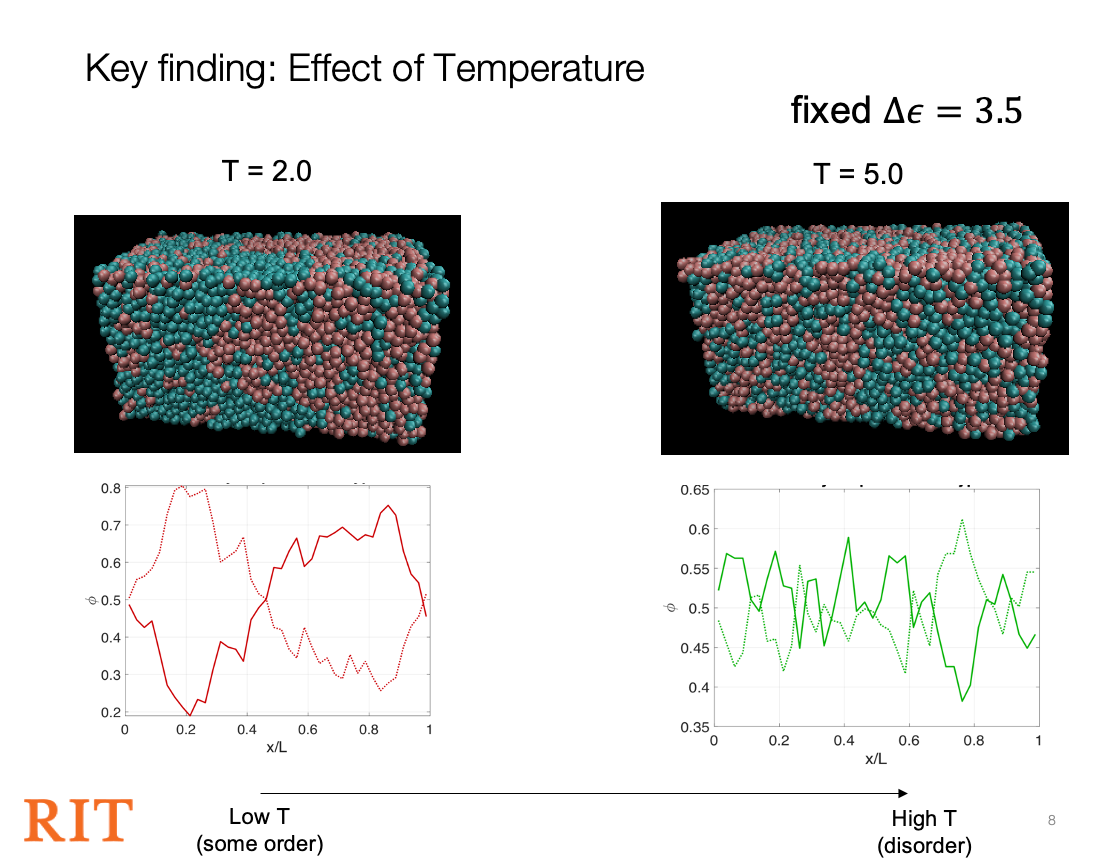
Here we can see the behavior of atoms as the temperature increases. We have a fixed simulation model, with identical initial conditions, such as structure, interaction strength, and other variables. In the following model, we use interaction strength equal to 3.5.
To the left we can observe that for Temperature equals 2.0, the structure is pretty ordered, and we can observe some signs of phase separation, which we can also see from the volume fraction graph below; maximum is approximately equal to 0.8.
However, as we set the temperature equal to 5.0, no phase separation is observed and the molecule is very disordered, having atoms spread randomly across the model.
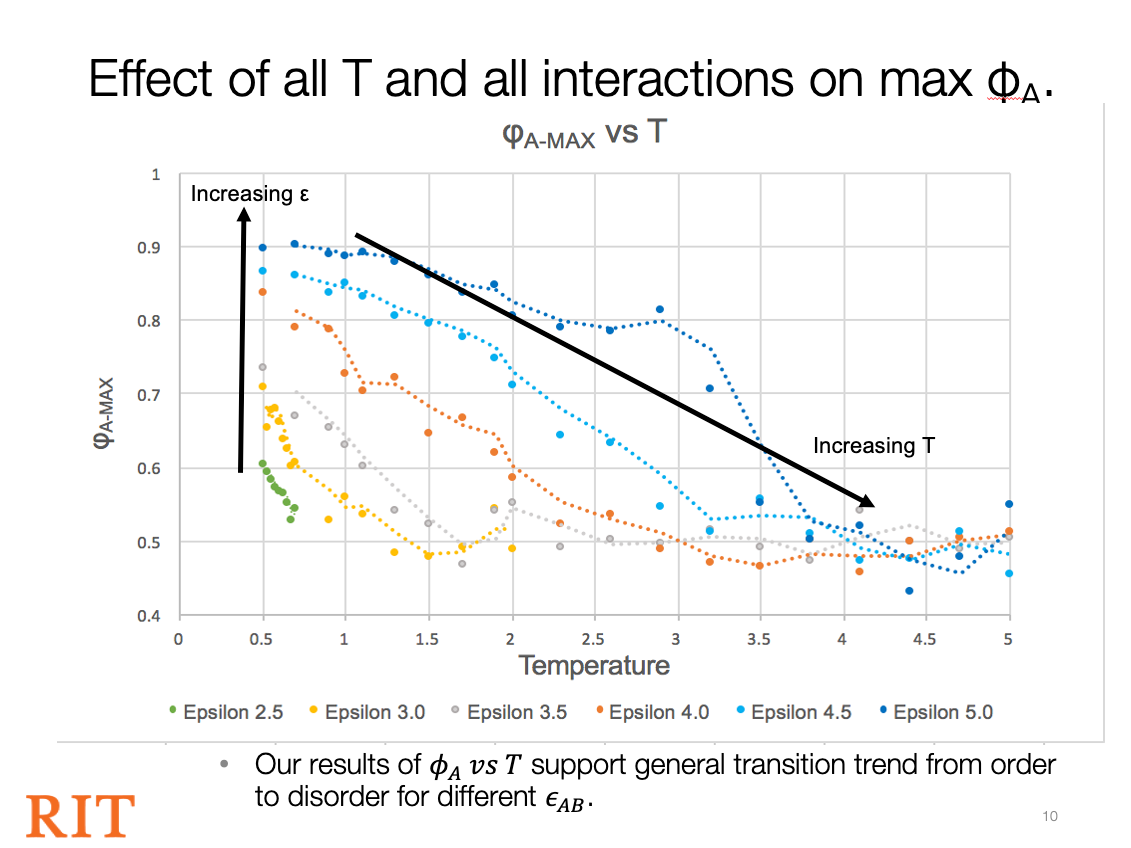
In the studied cases, higher temperature corresponded to lower Chi.
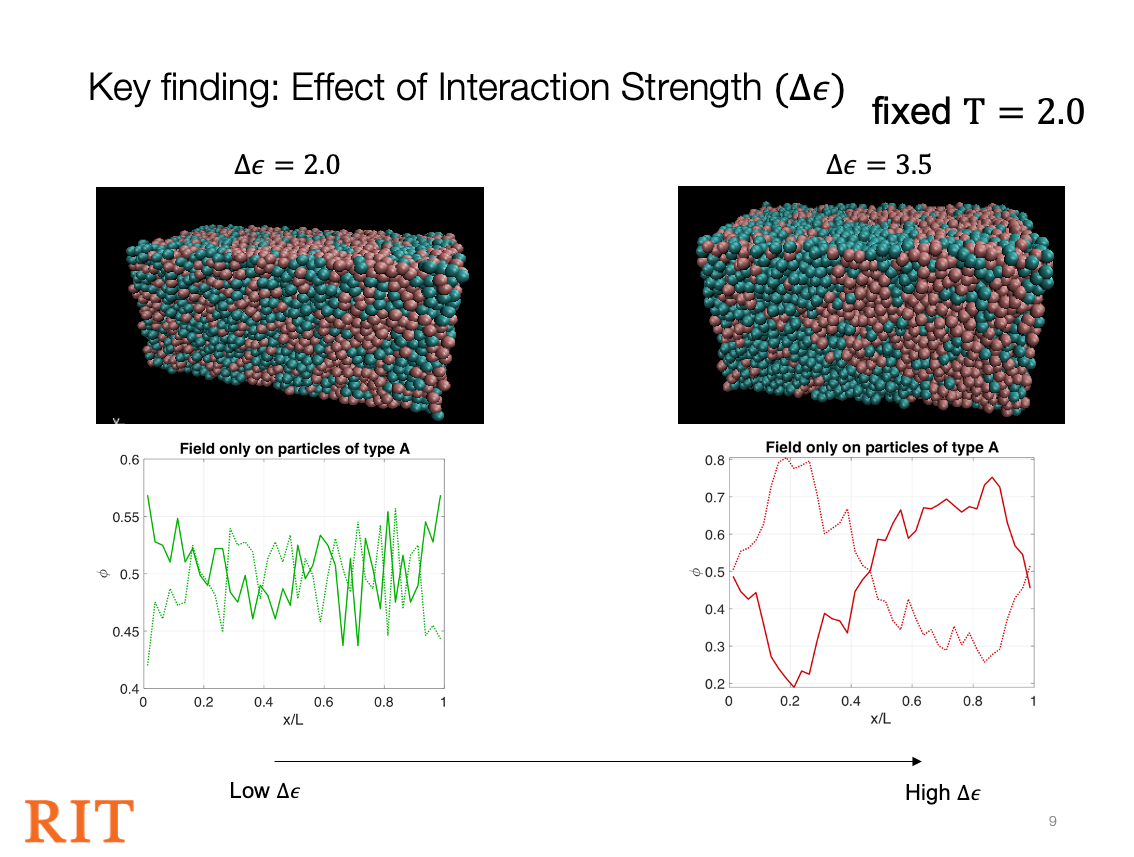
Similarly, to the previous slide, we kept all the variables constant, but now varying Interaction Strength, keeping Temperature at 2.0.
To the left, ϵ = 2.0, and we do not observe any phase separation, having atoms randomly spread. Based on the volume fraction graph below, we can see that maximum is approximately 0.55, which is a sign of a low Chi.
To the right, ϵ = 3.5, and there is a clear sign of phase separation. This set of graphs was described in the previous slide.
Based on the behavior we observe, we can see that in this case as the Interaction Strength increases, atoms phase separate more, and have a higher Chi. In other words, Chi increases whenever ϵ increases.
But is that true all the time?
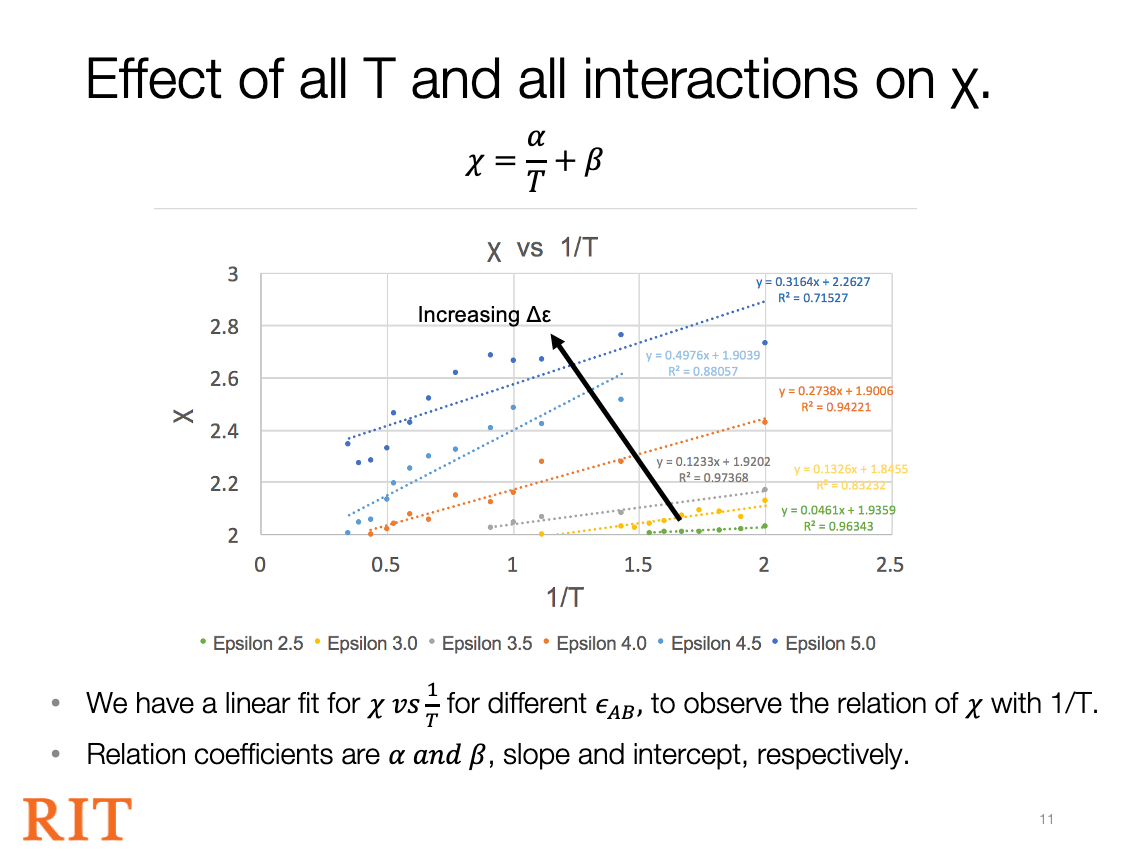
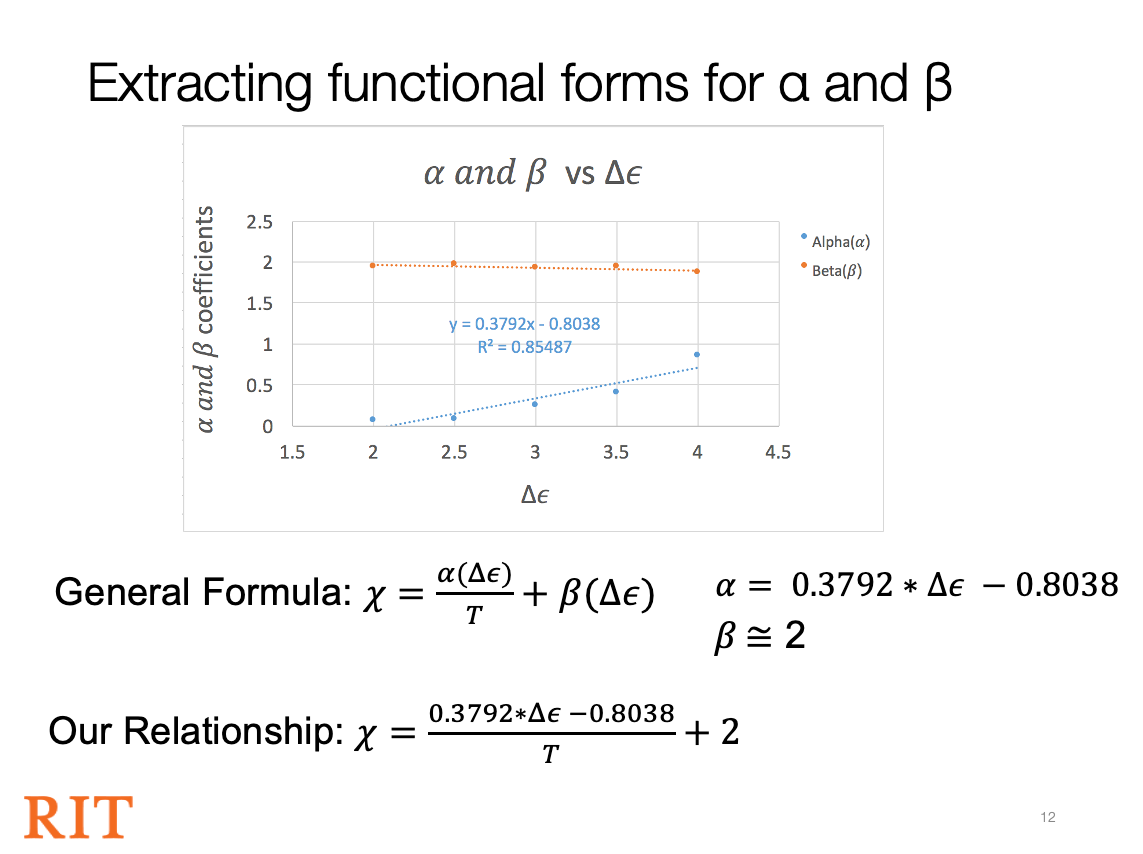
We plot alpha and beta, on the y-axis, vs on the x-axis. We collected coefficients of alpha and beta for different Interaction Strength, and we plot them all together fitting lines, to the relationship in-between them. Orange curve represents beta and blue curve is for alpha.
Based on the displayed data, we can observe that for the blue curve, line of best fit has a formula of y = 0.3792x – 0.8038. In this case, y stands for alpha, and x stands for ϵ. Based on the orange line of best fit, we simplified beta into 2.
Therefore, if we plug everything into our general formula, we get that Chi is reverse proportional to the temperature and directly proportional to the Interaction Strength.
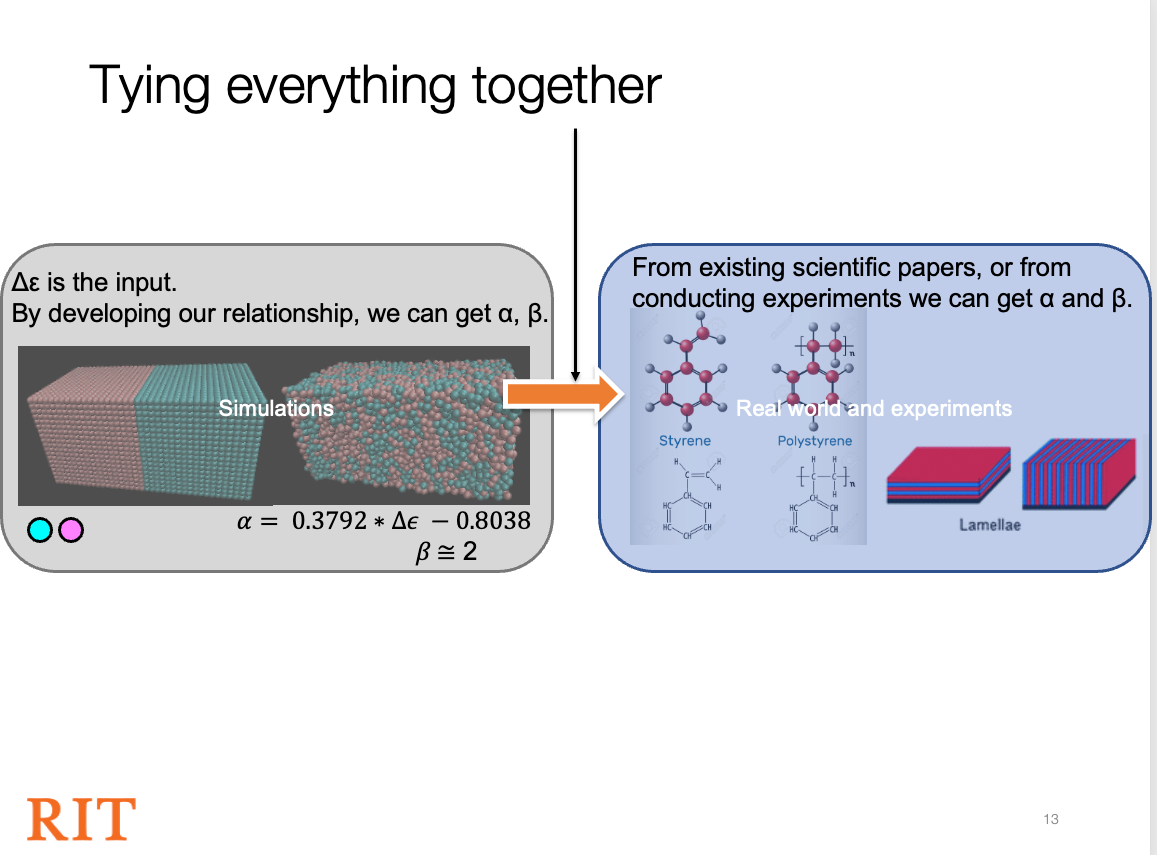
We understand that our coefficients might not be exact, but the main point of our research was to get a general sense that is going to allow us to proceed to experiments to get a factual and more physical data, which is going to benefit microfabrication.
The simulations gave us a starting point for future experiments. Comparing their results with physical measurements would let us refine the model.
In these runs, we mapped effective repulsion against the initial conditions we varied. Those relationships can help select conditions for later experiments.
Dr. Poornima Padmanabhan - for guiding and teaching me throughout the research.
RIT Honors Program - for providing an opportunity to conduct research.
Research Computing - for the computational resources.
Letter of Recommendation by Dr. Poornima Padmanabhan:
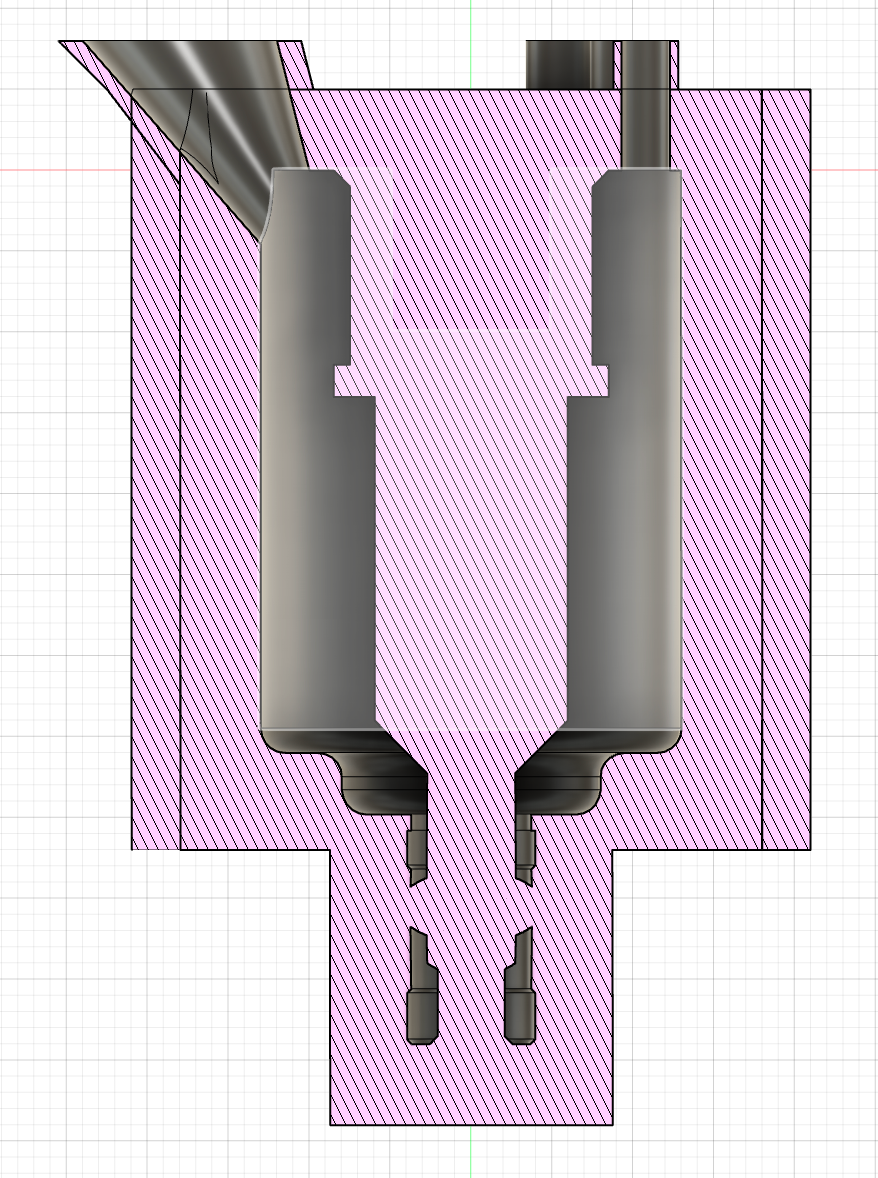
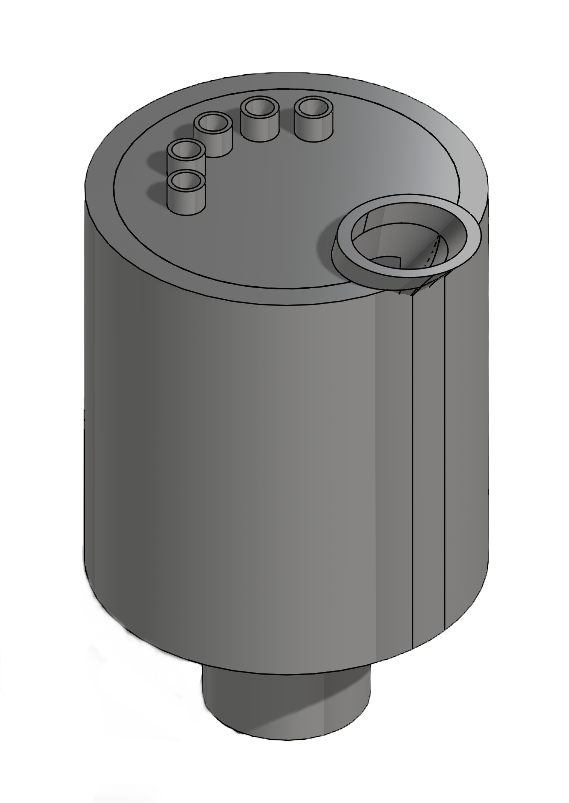
We created a negative mold on Fusion 360 adding holes for pouring the metal and drainage holes. We chose locating holes on that face because it will be the easiest to print that way. The most problematic section is boxed in RED. It will be hard to print 90 degree angle overhang. Therefore, we rotate the mold by 2 degrees. Test prints of the problematic sections were printed successfully.
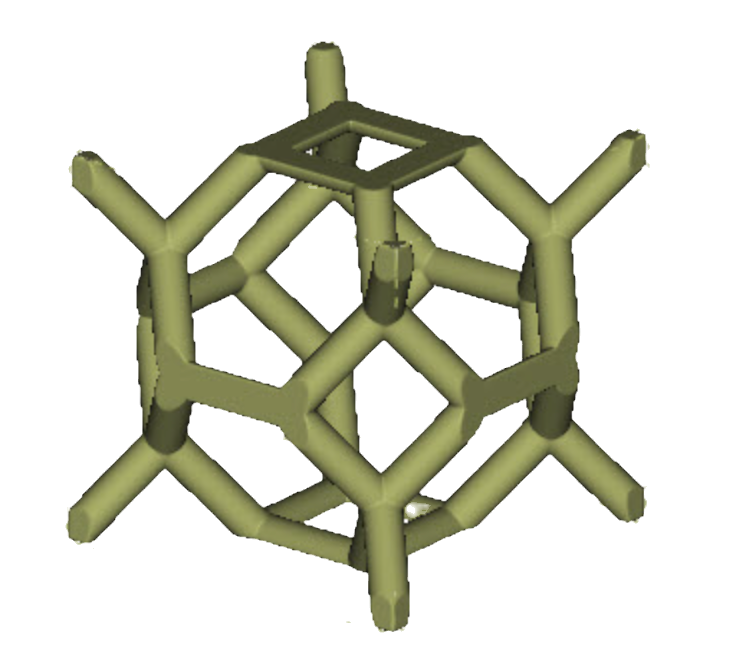
nTop was used to generate the lattice.
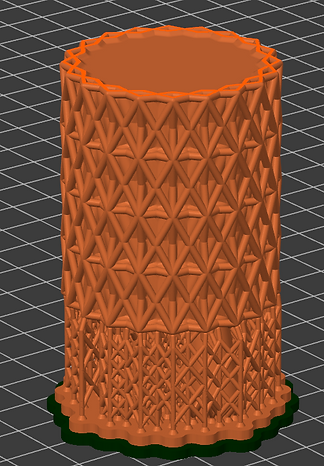
Lattice structure is important during the ceramic firing, it will prevent the mold from warping and shrinking, or if it shrinks it will assure it is uniform.
We always need to keep in mind the printability of the mold, so we chose Truncated Octahedron, because it is not too crowded and most of it is printed vertically.
Mesh was generated and exported as a STL file for further processing.
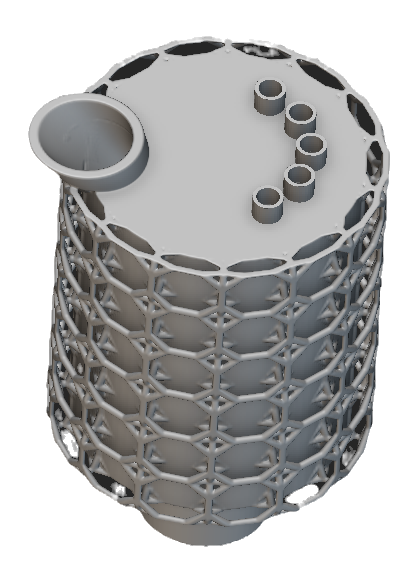
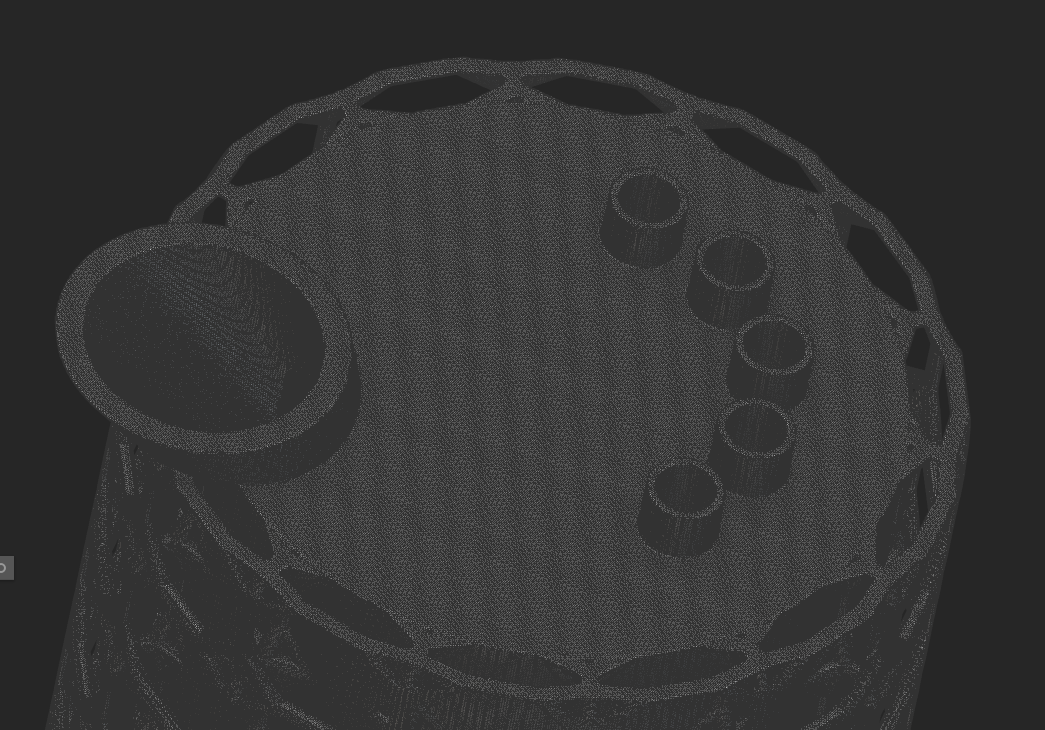
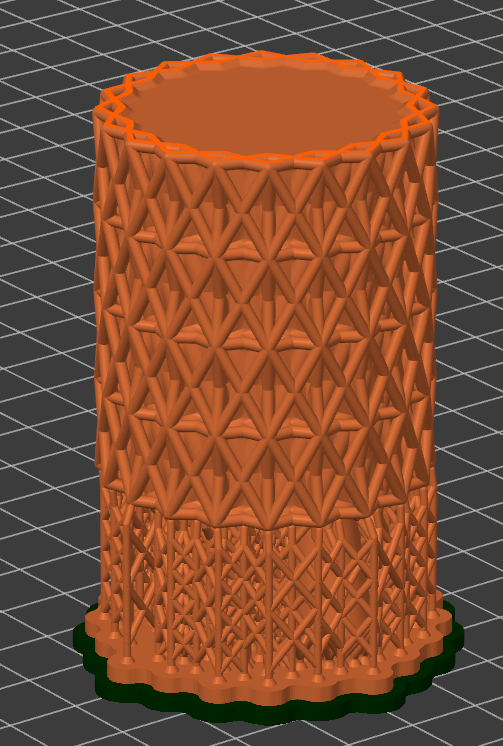
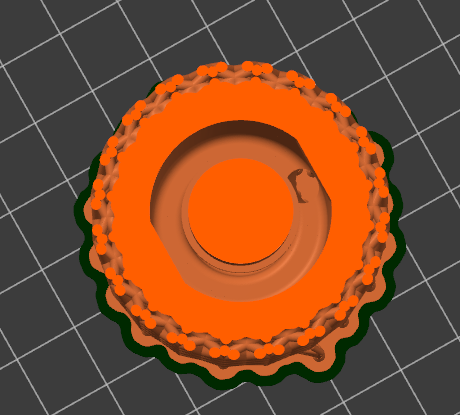
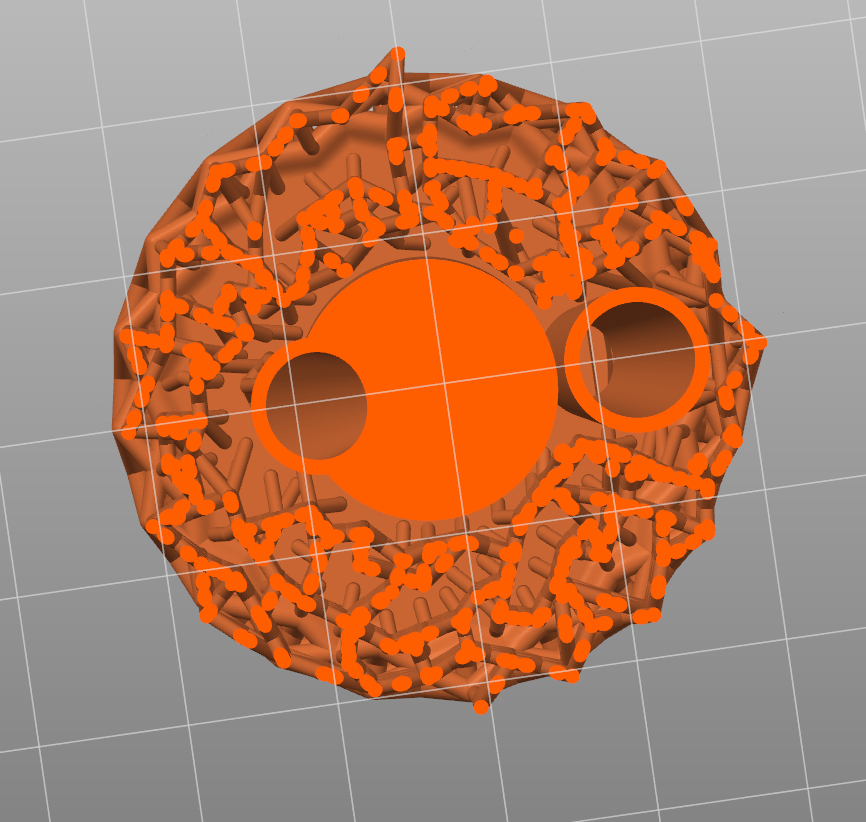
The ceramic mold was printed and furnace-fired.
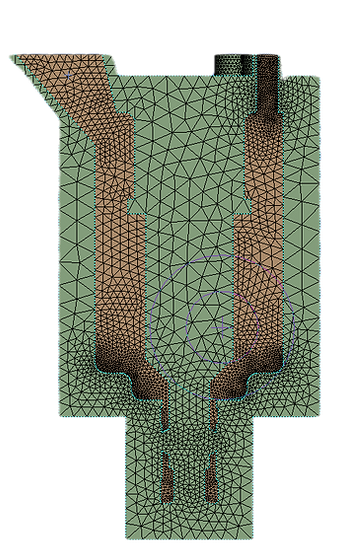
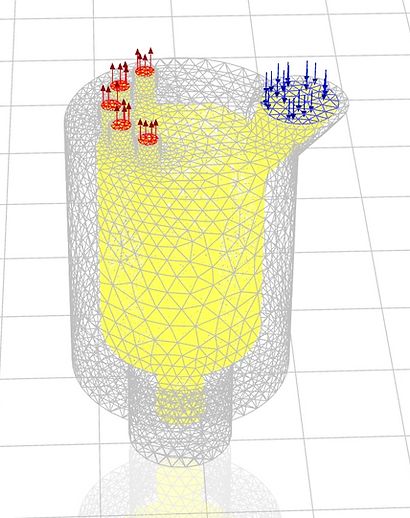
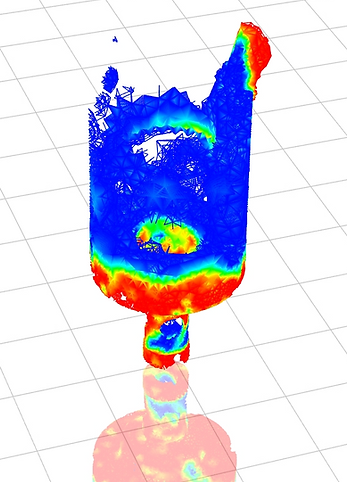
Simulate casting with liquid Aluminum inside the ceramic mold printed on a ceramic 3D printer. Mold is very small having ~5 cm Outer Diameter Temperature: 1273 Kelvin Phase Materials: Air and Liquid Aluminum Surface tension: 1.09 N/m Inlet Velocity of Aluminum: 0.1 m/s Transient Analysis Even though not perfect symmetry, symmetricity is assumed
we divide the model by half to make the simulation easier to process since we are fine with approximate results.
I wrote a custom STL-to-G-code pipeline in Python so I could inspect and control each stage of slicing. The program reproduces standard planar slicing first. That work prepares the code for later research into nonstandard slicing angles and support reduction; those later results are not claimed here.
An STL stores a model as triangles and vertex positions. The program displays that triangle mesh before using it to calculate the part outline at a chosen height. The source demonstration follows a sign-language R model through the pipeline.
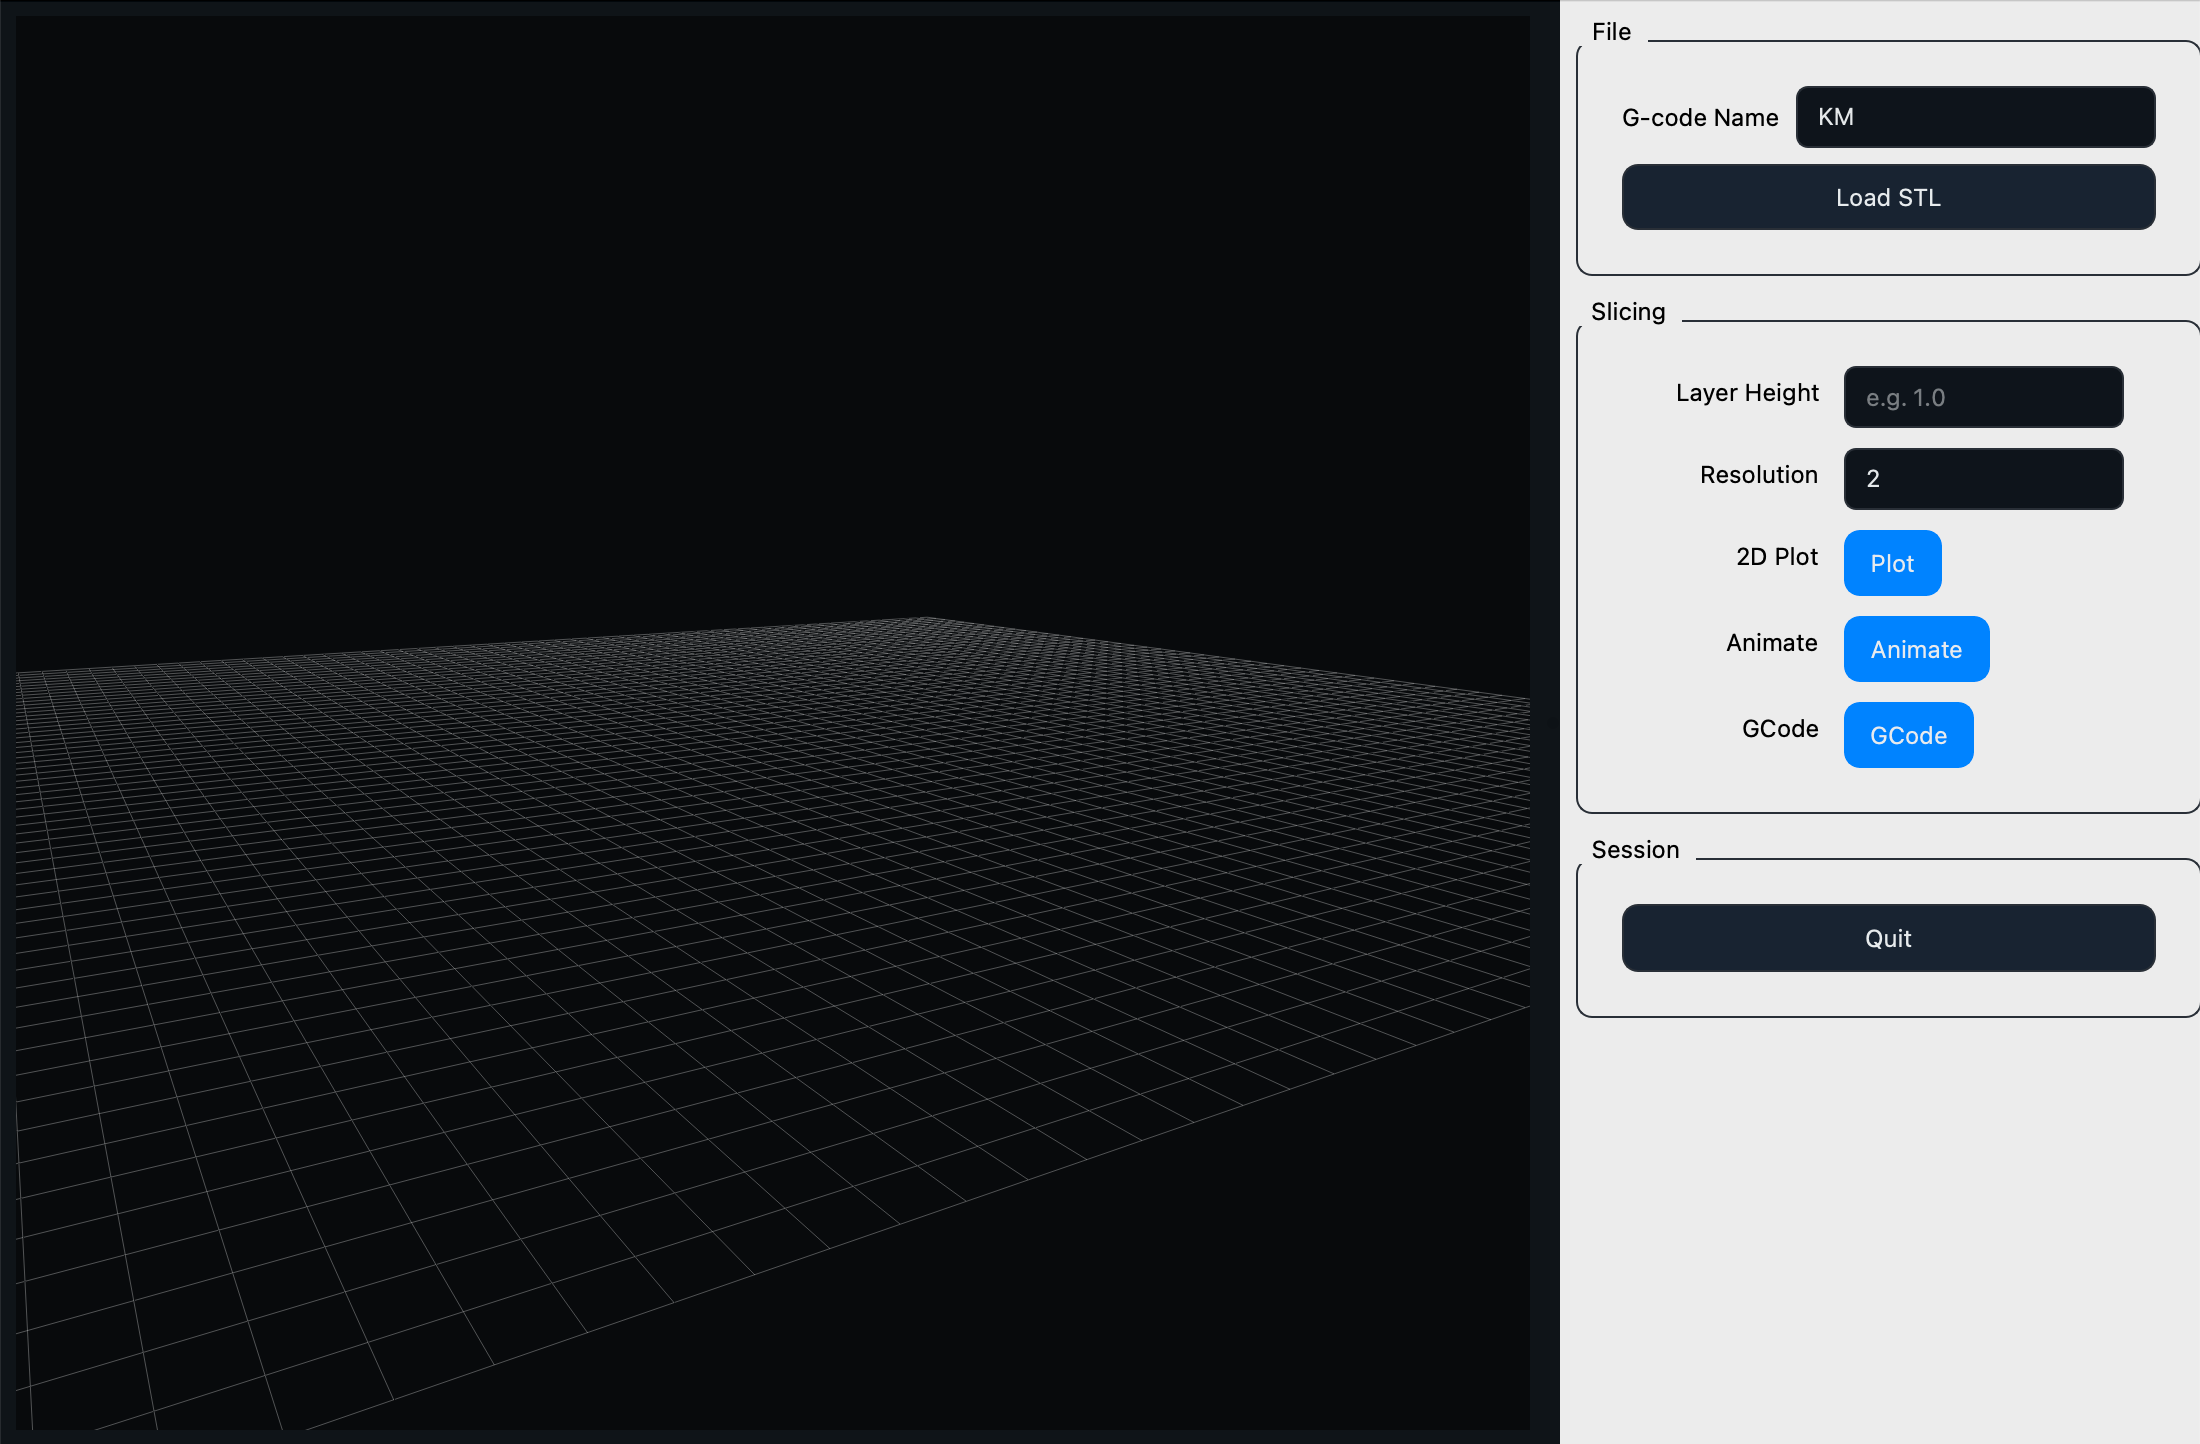
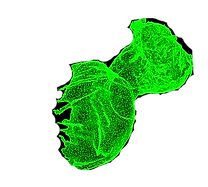
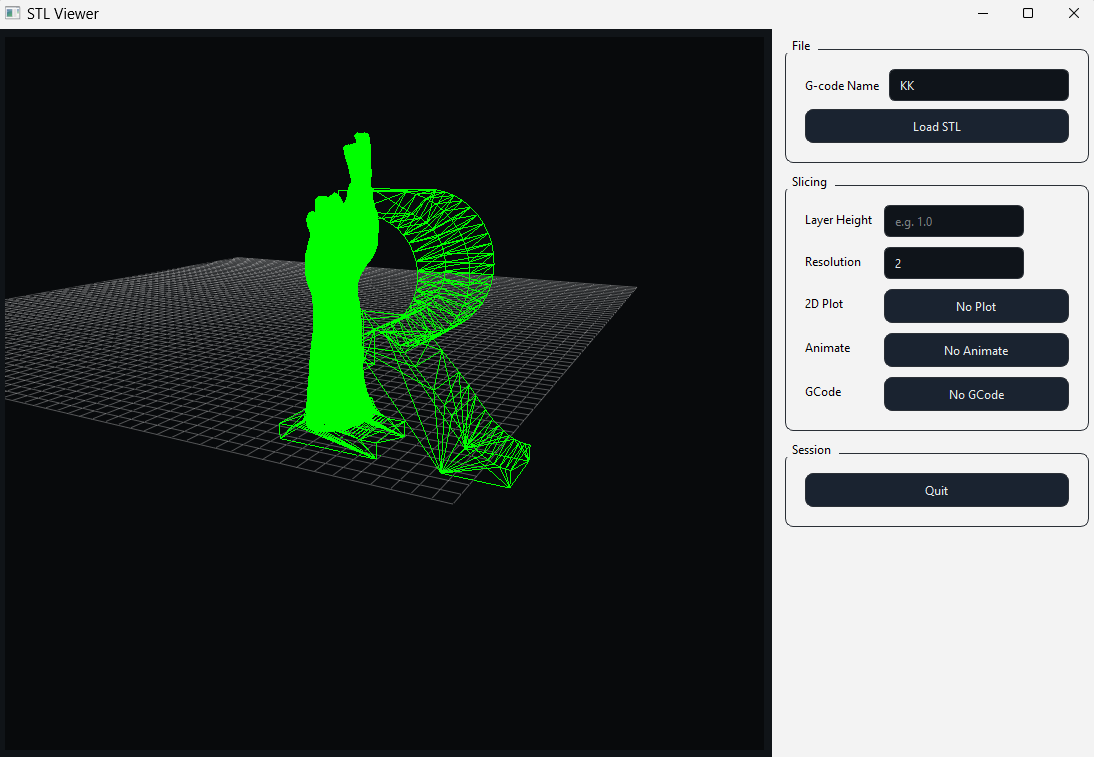
The selected layer height defaults to 0.2 mm. Each planar slice contains three outside walls and one inside wall, followed by generated infill. Delaunay triangulation helps construct the infill, and shortest-path ordering reduces unnecessary travel between toolpath points.
The program converts each layer into printer movement and extrusion commands. I loaded the output into a G-code visualizer, which reconstructed the R example and provided a direct check on the generated path.
;Min Z: 0
;Max Z: 5
;Layer Height: 1.0
;Generated with KSliceDice
M140 S60
M104 S200
G90
G28
G92 E0
;LAYER_COUNT:1
;LAYER:0
G1 F6000 X20 Y20
;TYPE:WALL-OUTER
G1 F500 X121.2901 Y158.5929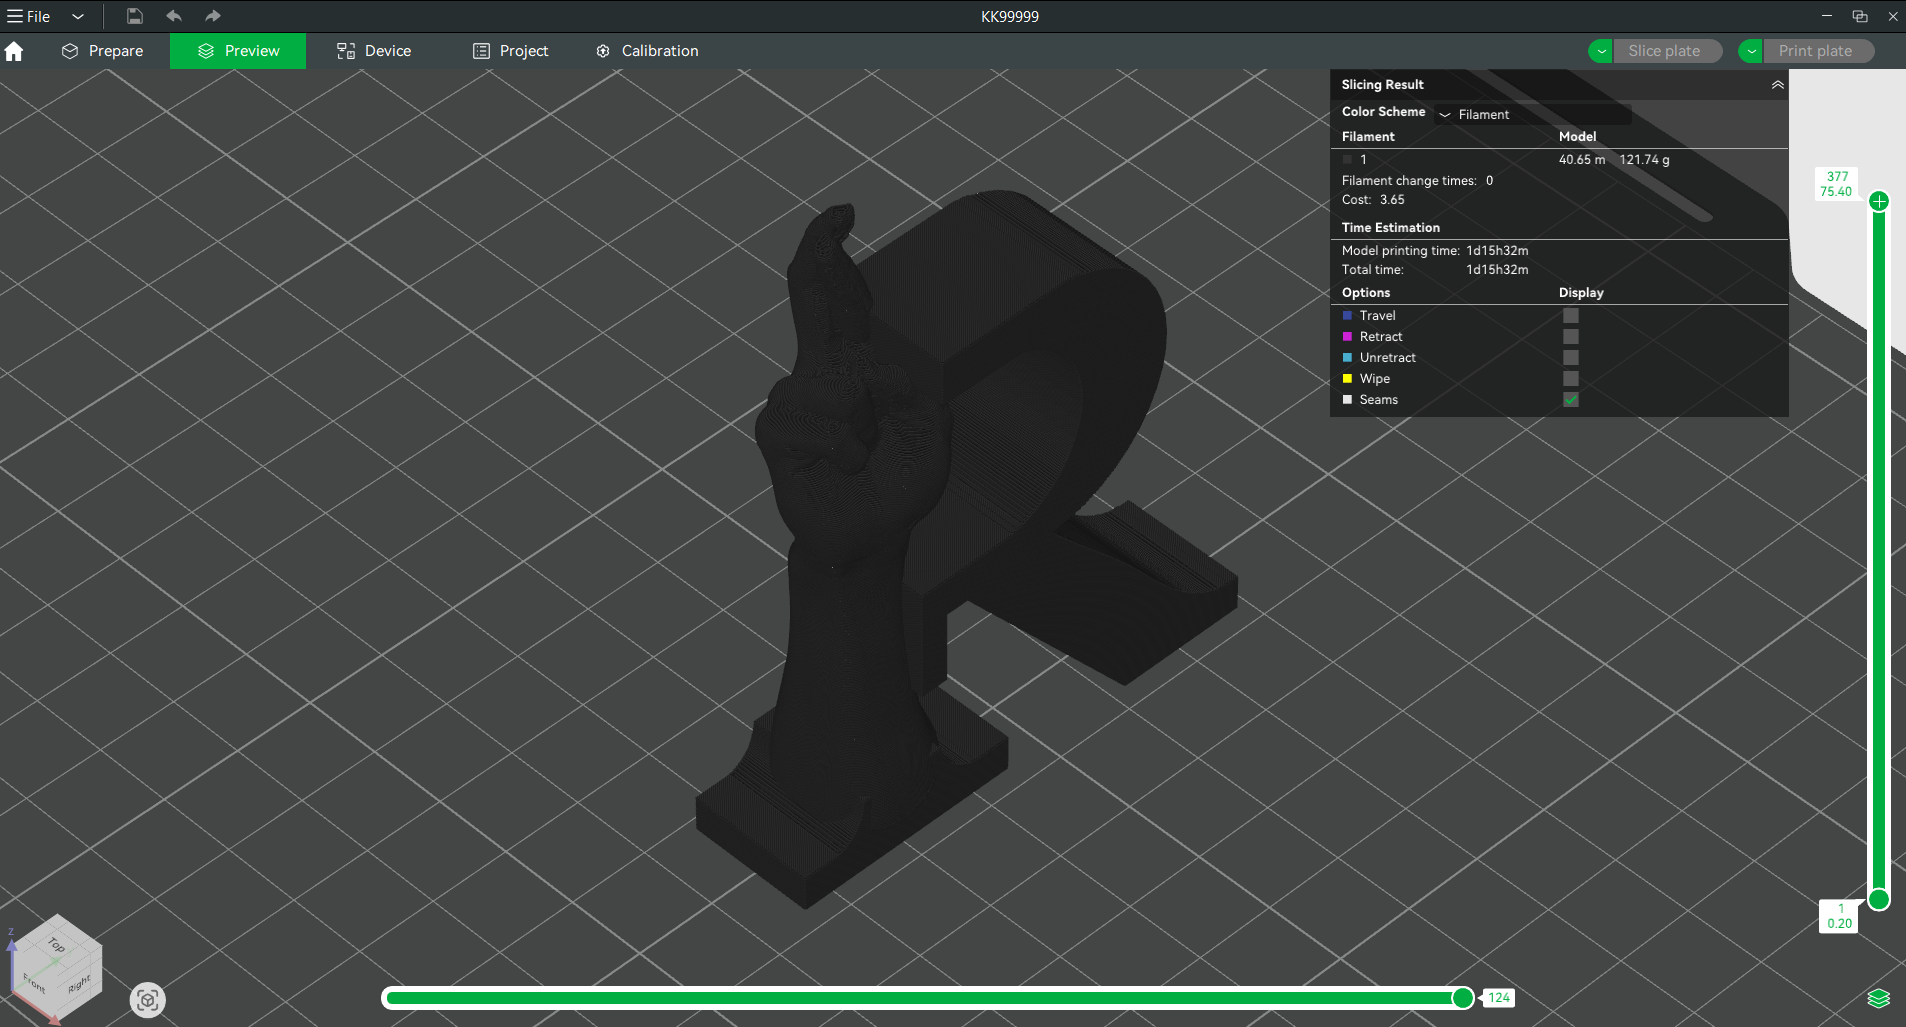
A steel-frame router built in a third-floor apartment, using the PrintNC reference design.
I sized the reference design in Fusion 360, then cut, drilled and tapped the steel members. High-infill printed components supported alignment and motor mounting as I assembled the frame and gantry.
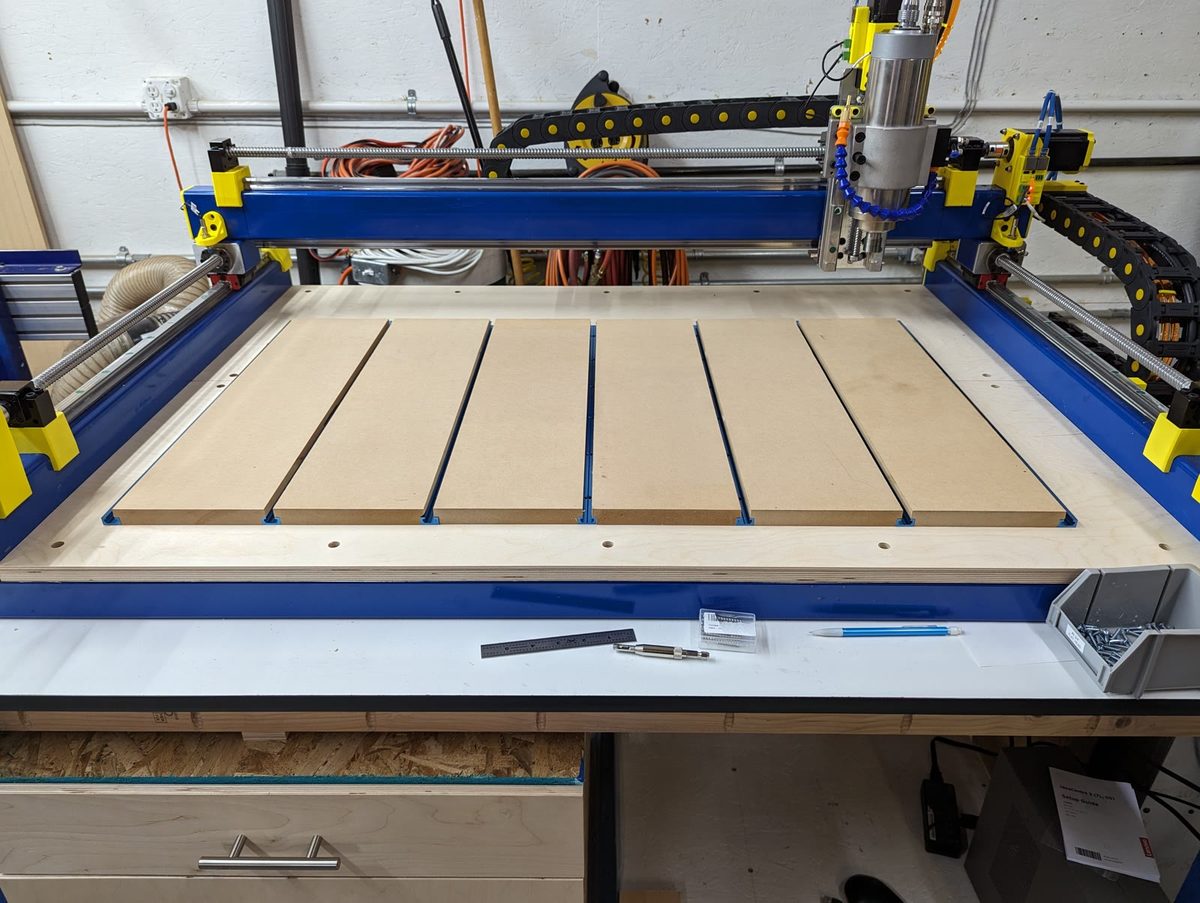
The 2.2 kW spindle and VFD required an EMI line filter, shielded cabling and a star ground. I integrated the controller firmware with the motor drivers, limit switches and emergency stops.
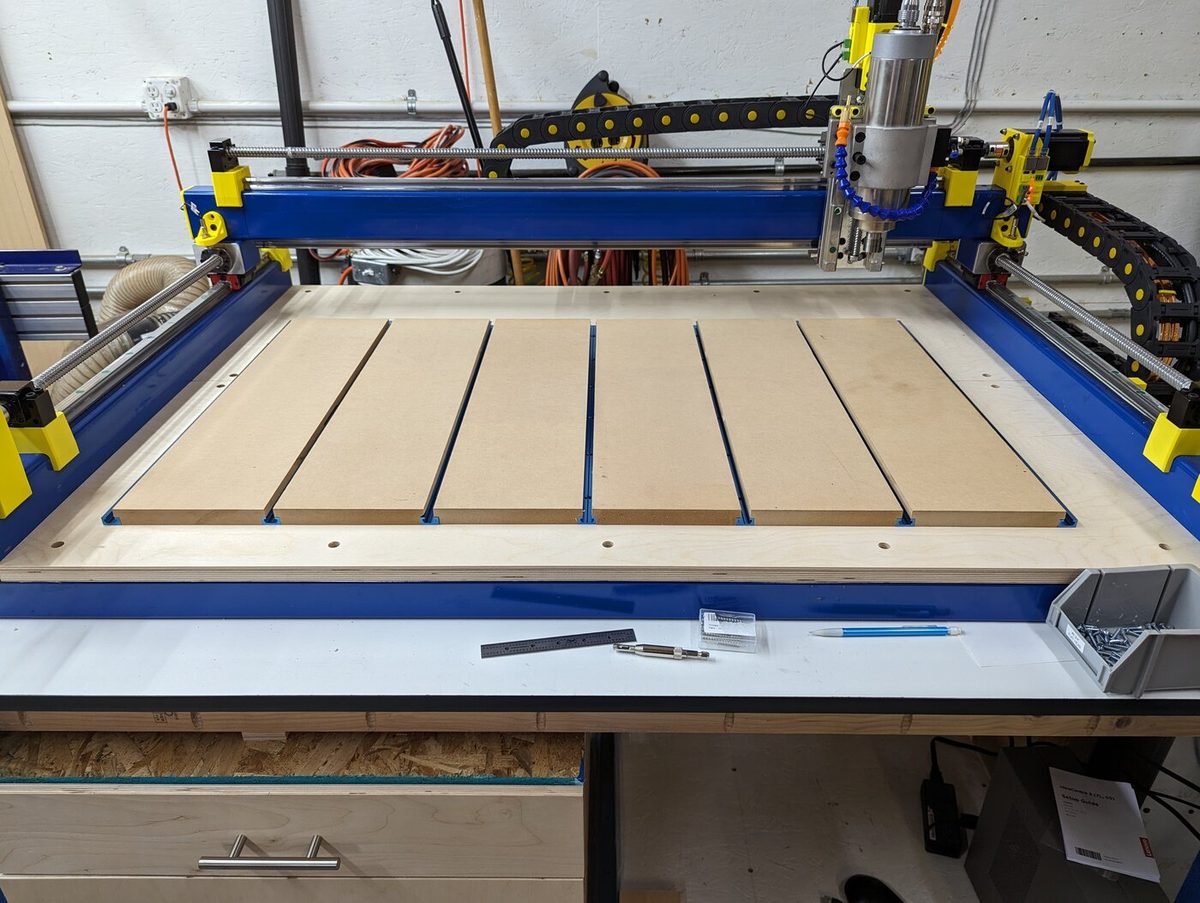
The source documents an operational router and test cuts. It lists a 1200 by 800 mm work area and a water-cooled spindle. The stated +/- 0.1 mm tolerance is a build specification, without a documented independent accuracy measurement.
Three studies that connect a model with measured motion or response data.
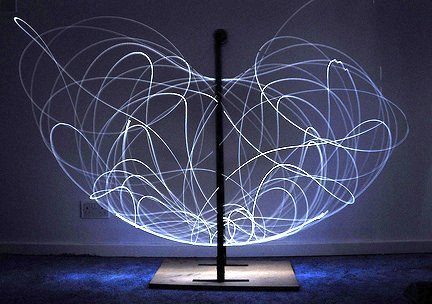
I compared a MATLAB model with a physical two-arm pendulum tracked in Kinovea. Starting angles were 45 and 0 degrees, with a 1000-run Monte Carlo uncertainty band. The study set a less-than-10-percent-error goal over the first two seconds; the source documents the comparison, without confirming that target was met.
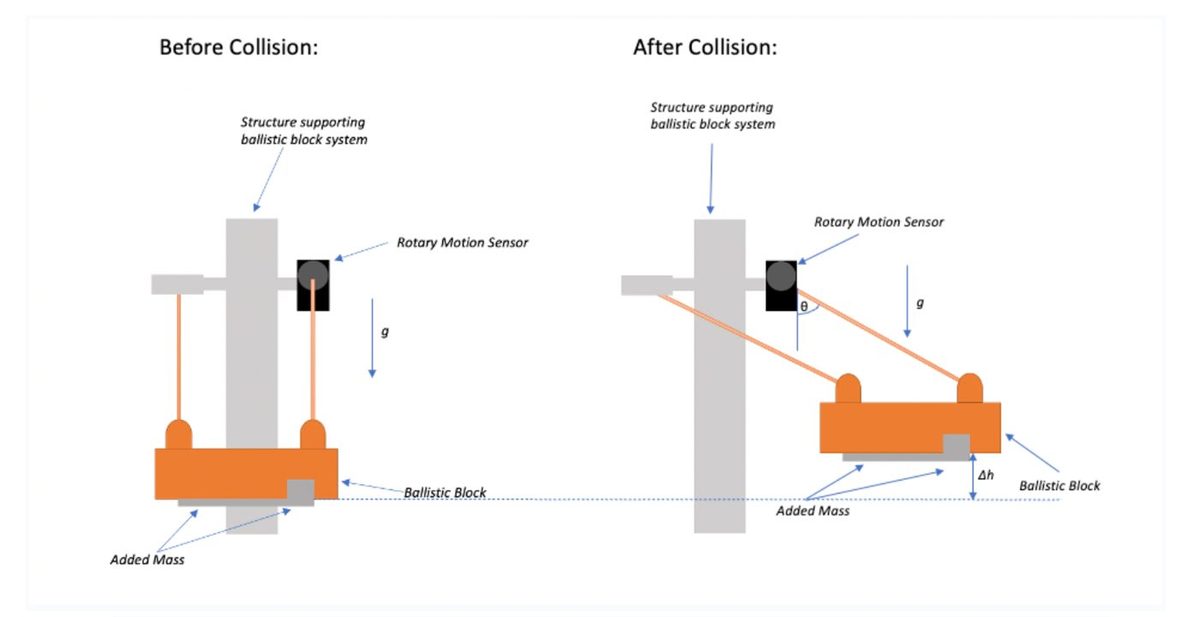
A 1.52 m PVC apparatus was tested 10 times at 2 and 8 kPa. An Euler model estimated exit velocity. Comparing it with measurements exposed the influence of inlet-flow assumptions, friction and leakage.
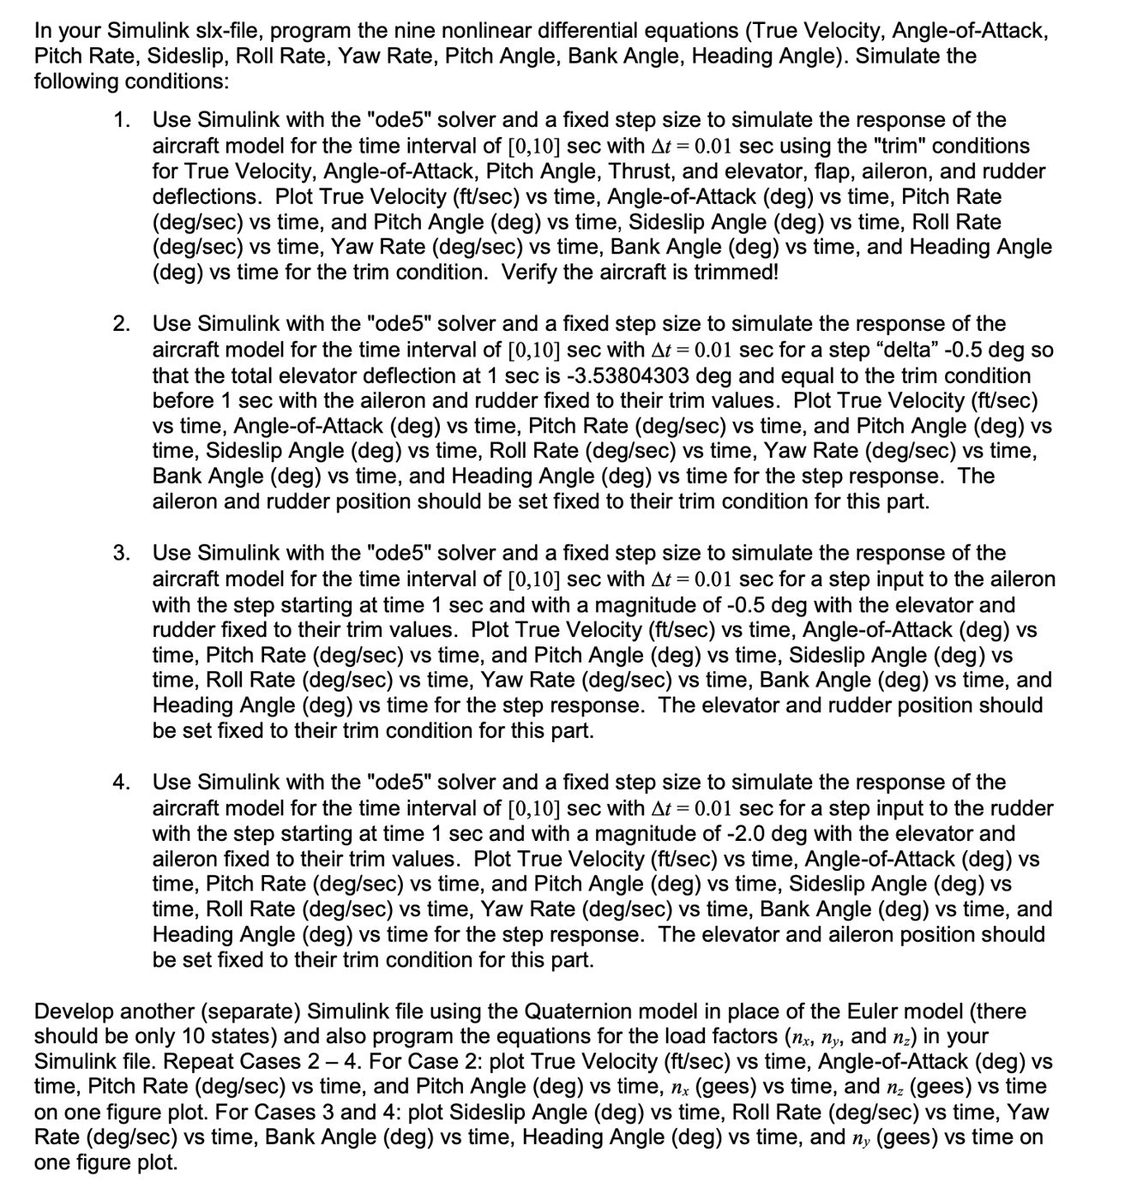
In MATLAB and Simulink coursework, I used quaternion attitude equations to simulate aircraft response without Euler-angle gimbal lock. The model produced response traces for comparison with flight-test data. This was coursework, not employment on an aircraft program.
Structural and fluid models. The available record differs by case.
A CornellX and ANSYS exercise modeled a periodic half-bolt sector of an F-1 nozzle under pressure, thermal conditions and bolt preload. A 1692 psi hoop-stress hand calculation compared with 1672 psi in FEA, a 1.18 percent difference. This was training, not work on NASA hardware.

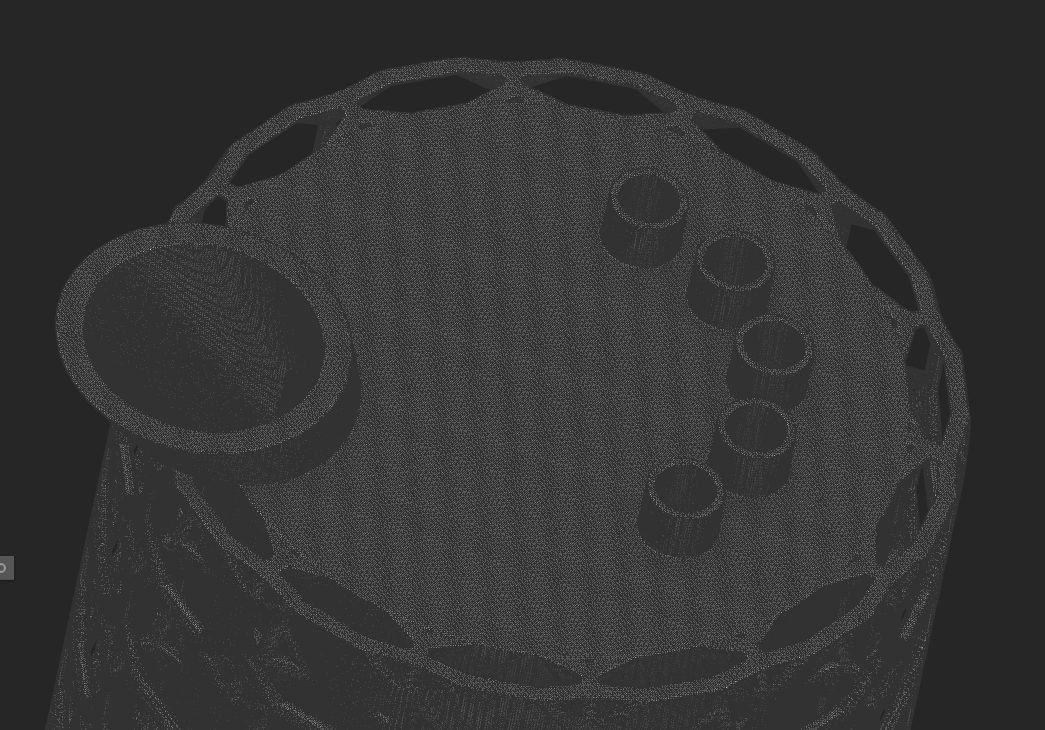
A transient half-model with air and liquid aluminium at 1273 K examined a planned water-nozzle pour for early freezing and trapped air. The ceramic mold was printed and furnace-fired; a completed casting is not documented.
I used FEA to assess fatigue at critical weld details for a tractor-frame redesign, then checked the model with strain gauges on the physical frame in the field. This connected the structural analysis to measured behavior.
Mechanical Systems Engineer. Vehicle programs for Raymond and Toyota.
I took the 4260 stand-up counterbalance from concept to production and mentored two junior engineers.
I lead teams of three to five engineers from concept through production for Raymond and Toyota Material Handling programs. The work includes mentoring junior engineers, defining project timelines with cross-functional teams, and presenting technical decisions and results to groups of up to 100 engineers.
Outside individual subsystem work, I perform stress and service-life prediction, including L10 life calculations; build custom fixtures for fatigue, wear, and lifecycle verification; and use test results to close the loop between analysis and hardware.
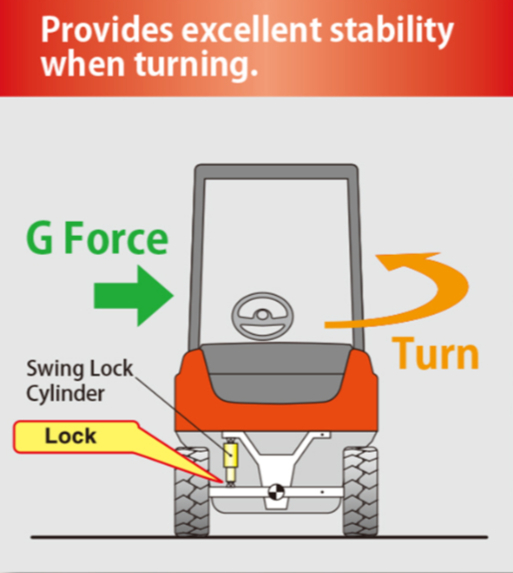
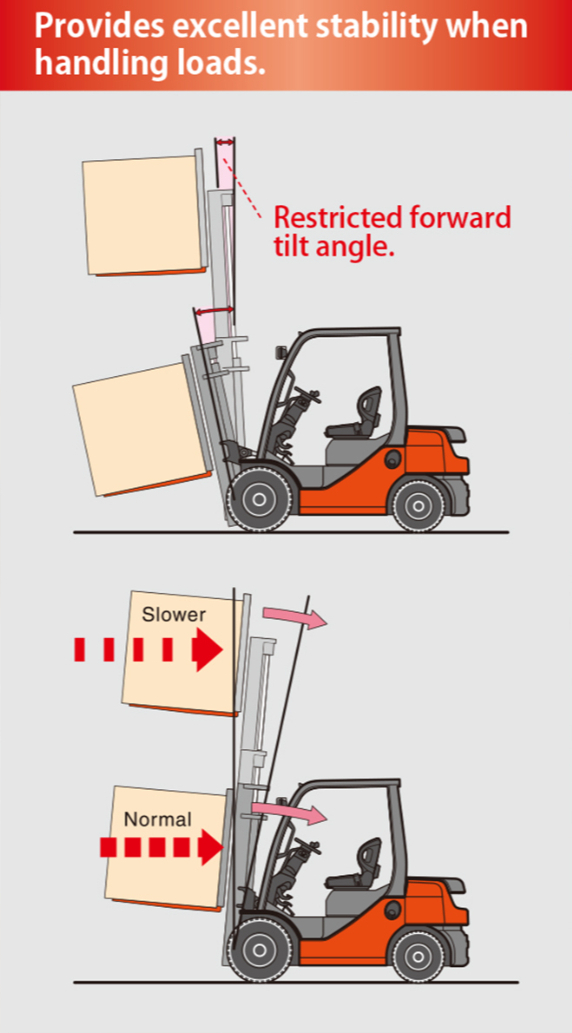
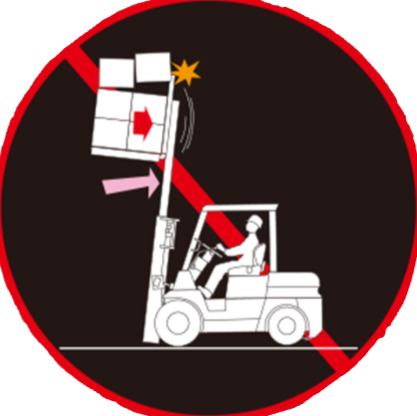
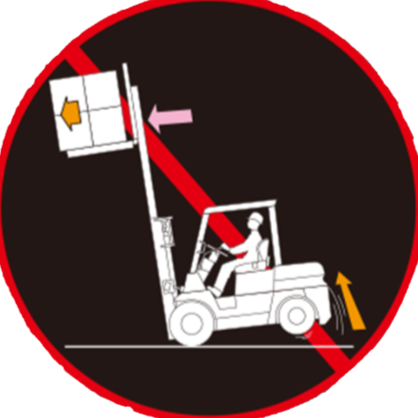
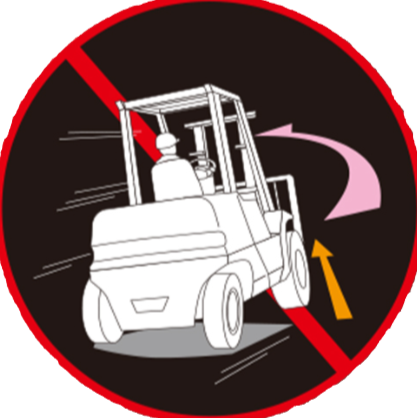
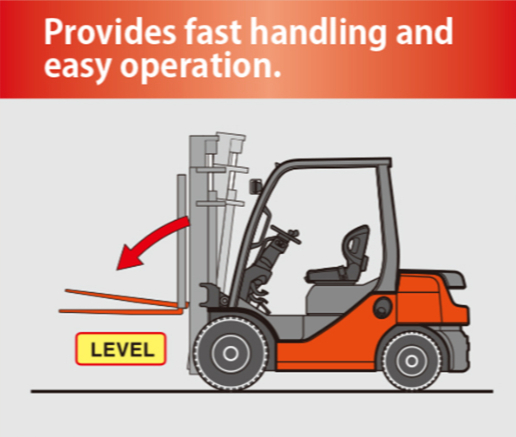
Inspired by Toyota’s System of Active Stability, this system addresses load-spillage prevention without over-limiting the truck. It reads load state on CAN and decides how much performance to allow; the reported outcome is 14 percent better performance with 10 percent less battery draw against the prior baseline.
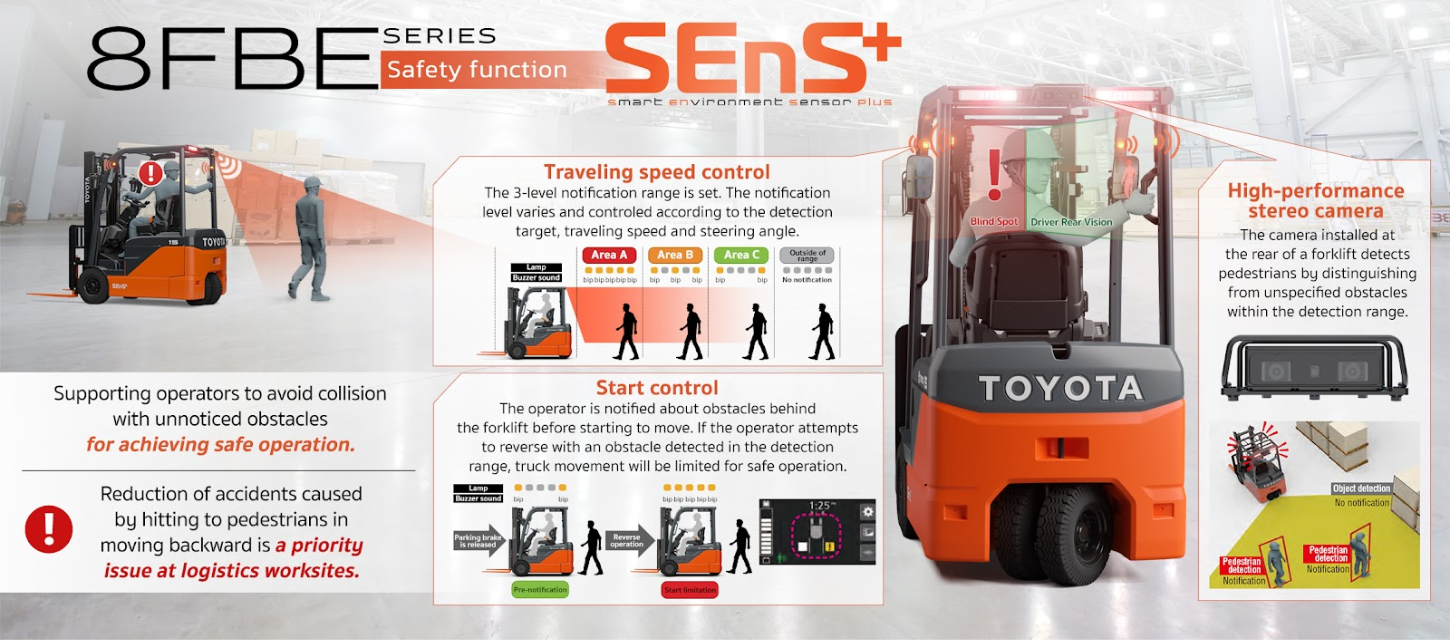
SEnS+ SUCB uses machine-learning detection and stereoscopic vision to identify pedestrians and obstacles, then connects the result to regenerative braking. I carried the work from R&D through a customer-ready system, including the speed-based zones and braking decision path.
Pressure transducers in the hydraulic system feed signal processing that converts pressure into load weight. The calculated weight drives the operator display and active speed overrides as the truck approaches its permitted load condition.
AC steering logic uses higher sensor resolution to refine drive-tire steering geometry in real time. The design goal is a tighter handling envelope while preserving operator feel.
The public record ties the system to both maneuverability and tire wear. The implementation is a controls problem at the drive tires: read the steering state precisely enough to differentiate the response while keeping the vehicle predictable to its operator.
The vehicle menu was organized around safety classes and operator access levels. A role-aware state machine keeps critical settings accessible only to the user and vehicle state that permit them, while preserving the controls technicians need.
Frame fatigue cracks appearing late in service drove a redesign focused on removing the failure mode at critical weld details. I used FEA to assess fatigue, built and tested physical prototypes under stress, and checked the resulting frame with strain gauges in the field.
I conduct patent-landscape reviews to protect design freedom, provide technical consultation to Legal and Marketing, and support approvals and compliance work. My continuing training includes GD&T, DFMA, failure analysis, functional safety for machinery, technical project management, and mentorship.
Product engineering, variable cam timing. June to December 2022.
I optimized prototypes against stress, wear, cost, and DFMEA, so the design that moved forward had already been pushed on where it was weakest.
I wrote a MATLAB tool that automated the data compilation for teardown reports, pulling together torque, pull-off, and staking forces instead of assembling them by hand. Measurements and end-of-line tests fed the material and design decisions.
I prototyped electric VCT units and ran end-of-line tests on them to finalize the materials and the design. No photo. The prototypes and test benches are BorgWarner property.
The teardown tool standardized torque, pull-off, and staking-force reports for Cummins, Harley-Davidson, and Ford.
Packaging reliability engineer, non-alcoholic drinks line. July 2021 to January 2022.
I designed a new sorting system aimed at the specific stages where the packaging line was stalling.
Before designing anything, I analyzed the production line to find the design inefficiencies that were dragging Overall Equipment Effectiveness down.
I prototyped the sorting system on the line. No photo. The prototype ran on Boston Beer's Allentown non-alcoholic drinks line.
The change lifted Overall Equipment Effectiveness by 7 percent, measured against the line's prior baseline.
Personal, ongoing. Started at RIT. FDM, PLA and PETG, CAD.
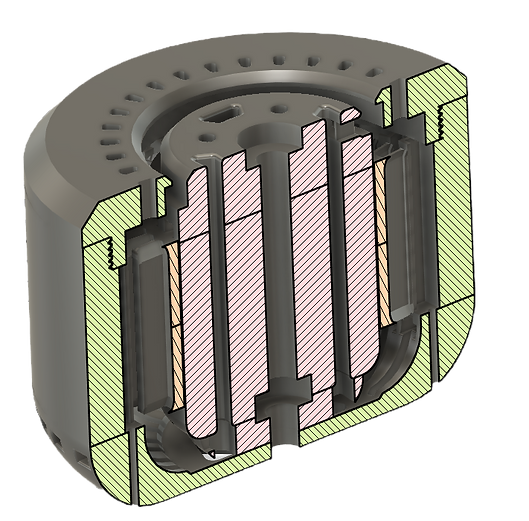
I designed an electric motor from scratch, inspired by Christoph Laimer, with a printed stator and rotor and copper wound by hand around the teeth.
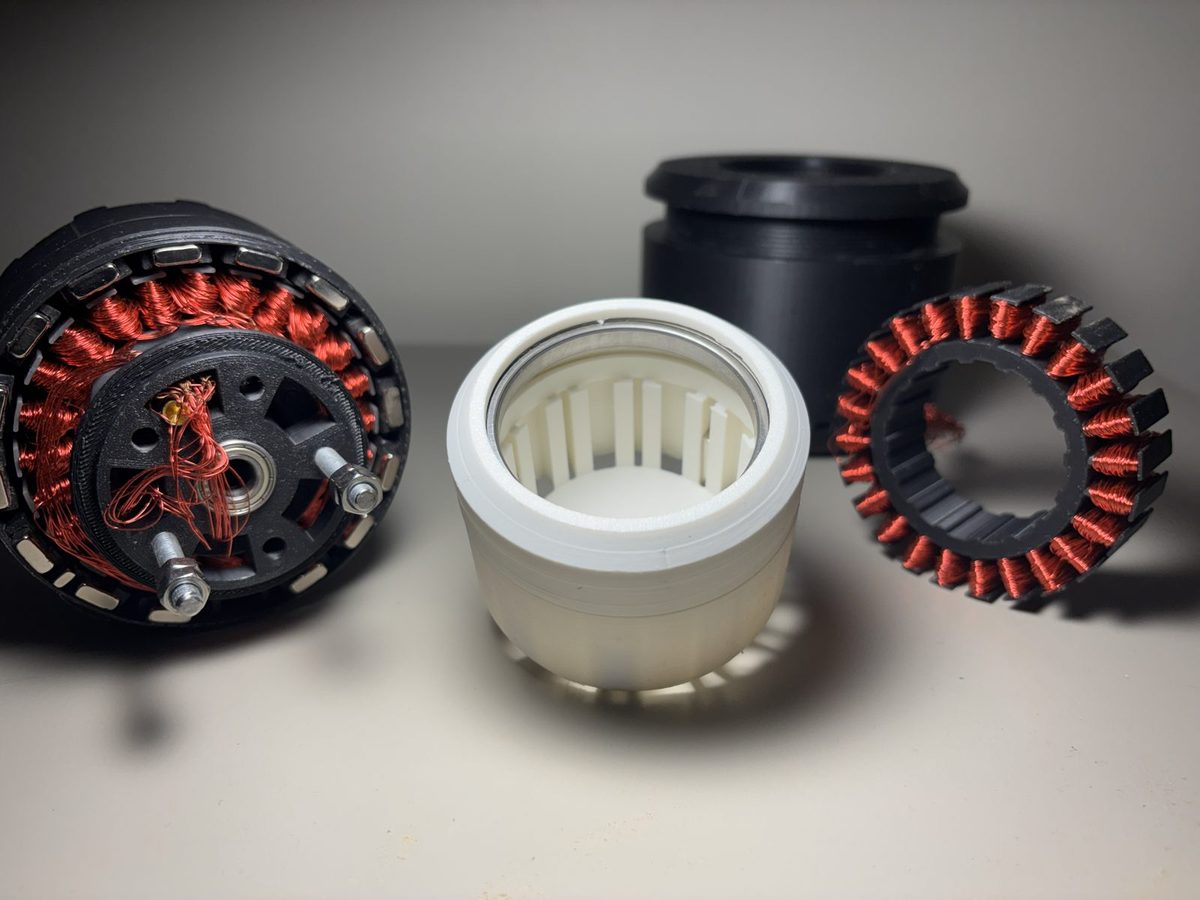
The prototype runs but overheats. Several load-bearing parts are PLA, which softens under temperature, so the honest fix is PETG or PA-CF for the structural pieces. That's the finding, not a footnote.
I wound the stator by hand and assembled the motor on its bearing. The same practice produced a MagSafe stand for my wife and an Iron Man MK7 helmet finished through sanding, filler, and paint.
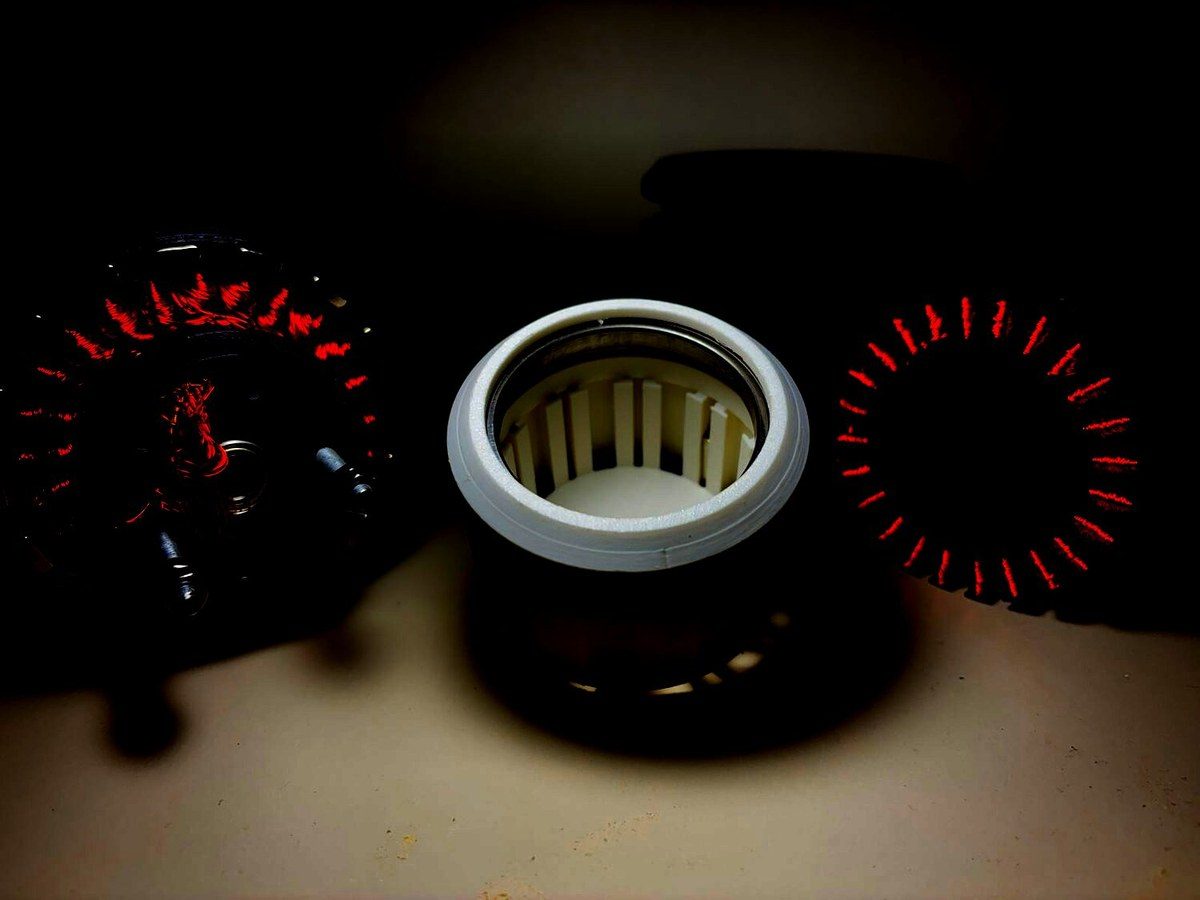
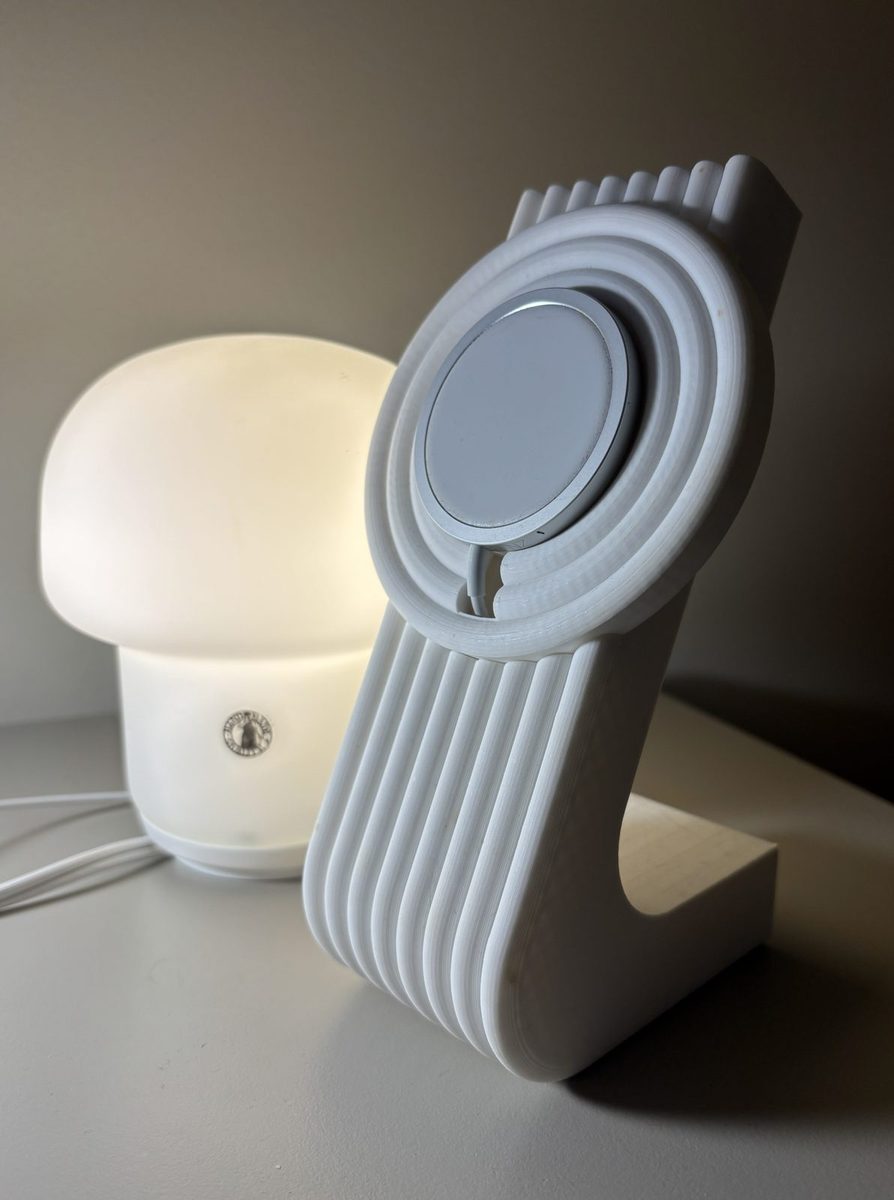
The motor spins, which proved the geometry and the hand winding work even though the material choice doesn't. The MagSafe stand costs about 4 dollars of PLA against a 69 dollar store version, and it's on my wife's bedside table.
3D printing began as a way to iterate quickly when every spool purchase mattered. At RIT, hearing Dr. Denis Cormier discuss the AMPrint Center led to a year as a lab assistant and undergraduate researcher. The habit carried from personal CAD and prototypes into more formal additive-manufacturing work.
The motor was inspired by Christoph Laimer’s work and by the book Brushless Motors: Magnetic Design, Performance, and Control. Its failure mode is useful evidence: the magnetic geometry and hand winding work, while PLA structural parts soften under load and heat.
The helmet process was practical post-processing: join the printed parts, sand to shape, apply filler and primer, sand again, paint, then add a protective clear coat. Fit became the next constraint. The first helmet did not fit, so the future scaling workflow begins with a body scan. Small SG90 servos, hinges, and an Arduino were explored as a prototype route for motorizing the mask.
The MagSafe stand began with a product seen in a feed and a simple cost question: buy a $69 stand or model one from about $4 of PLA. The final form references a bedside lamp and uses the part’s own printed texture as a design feature, making the small object an example of CAD, fit, material, and context resolving together.
SG90 servos and hinges move the faceplate, controlled with an Arduino. The actuation worked as a prototype, but the helmet did not fit my head. Scanning myself supplied a reference for scaling a future helmet.
RIT coursework, dynamics and validation. MATLAB, Kinovea.
I derived a Lagrangian model of the two-arm pendulum and integrated it as a set of ODEs in MATLAB. Chaos means the interesting question isn't whether it matches, it's how long before it stops matching.
Kinovea tracked the pendulum motion and supplied angle data for MATLAB comparison. A 1000-run Monte Carlo study formed an uncertainty band around the model at the 45 and 0 degree initial condition.
Two solid arms on bearings, with the top arm released from 45 degrees against a hard stopper for a repeatable start.
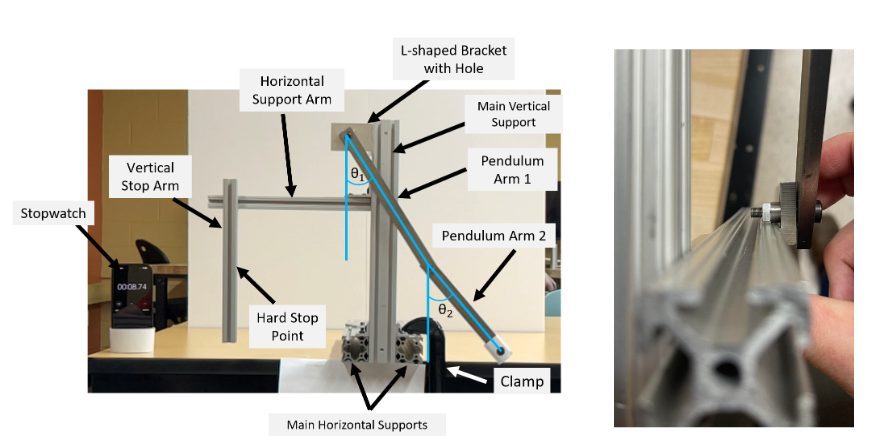
The stated goal was less than 10 percent error during the first two seconds. The model and tracked test were compared against the uncertainty band; the source does not state that the target was achieved.
RIT coursework, fluid dynamics and validation. MATLAB.
The setup is a 1.52 m PVC pipe sealed at both ends with tape, a vacuum pump, and a ballistic block that records displacement when the ball lands.
An Euler method estimated exit velocity in small time steps, including a Vena Contracta entrance coefficient. The model deliberately simplified inlet flow, friction, and air leakage around the ball.
The 1.52 m PVC course apparatus paired a vacuum pump with a catch mechanism that recorded displacement for exit-velocity calculation.
Ten tests at 2 and 8 kPa compared measured and predicted exit velocities. Differences point to the flow, friction, leakage, and tape-rupture assumptions that need higher fidelity.
RIT coursework. Simulink, MATLAB, ode45.
I built a quaternion attitude model rather than Euler angles, because Euler angles hit gimbal lock and integration singularities. Quaternions avoid that, at the cost of being harder to read off the page.
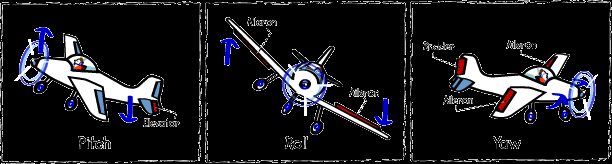
The MATLAB and Simulink course model applies set conditions and logs the response for comparison with flight-test data.
This one is a course model, not hardware. The build is the Simulink and MATLAB implementation of the quaternion formulation.
The logged response curves can be compared directly against real flight-test data to check the control behavior.
CornellX and ANSYS training. Simplified Rocketdyne F-1 nozzle.
The training model reduced the conical nozzle to a periodic half-bolt sector, representing a repeating part of the bolted mid and lower nozzle assembly.
Pressure, thermal conditions, bolt preload, contacts, and supports were applied within the student-version mesh limit. This is a training model, not a validation of a historical flight article.
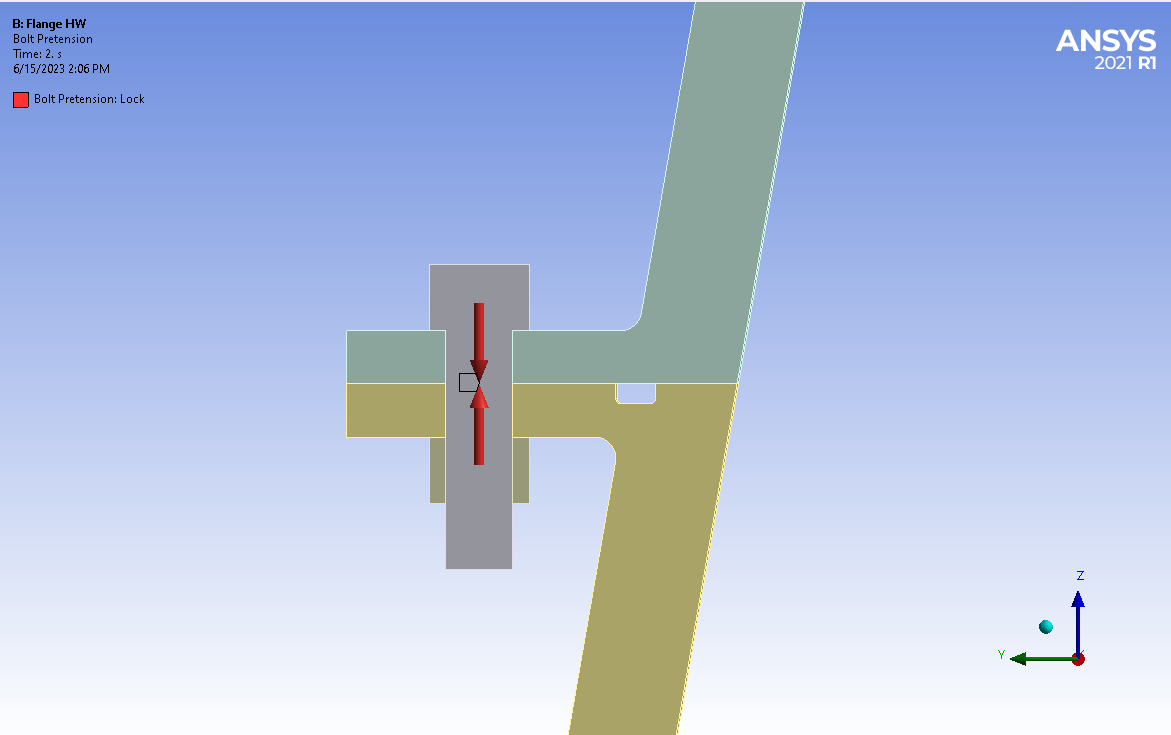
A hoop-stress hand calculation at the lower-nozzle tip was approximately 1692 psi. The FEA result was 1672 psi, a 1.18 percent difference for this simplified comparison.
2022 to 2023. Structures and integration.
The first RIT student-initiated project built to fly to space. I contributed to the mechanical side, structures and integration.
No public photos or plots I can post here. Image slot pending from Kambar.
RIT Robotics Club, 2022 to 2023. Control systems.
Design improvement and joint-movement control system work on the club's quadruped robot. A team project.
Shared team media, so nothing to post here. Image slot pending from Kambar.